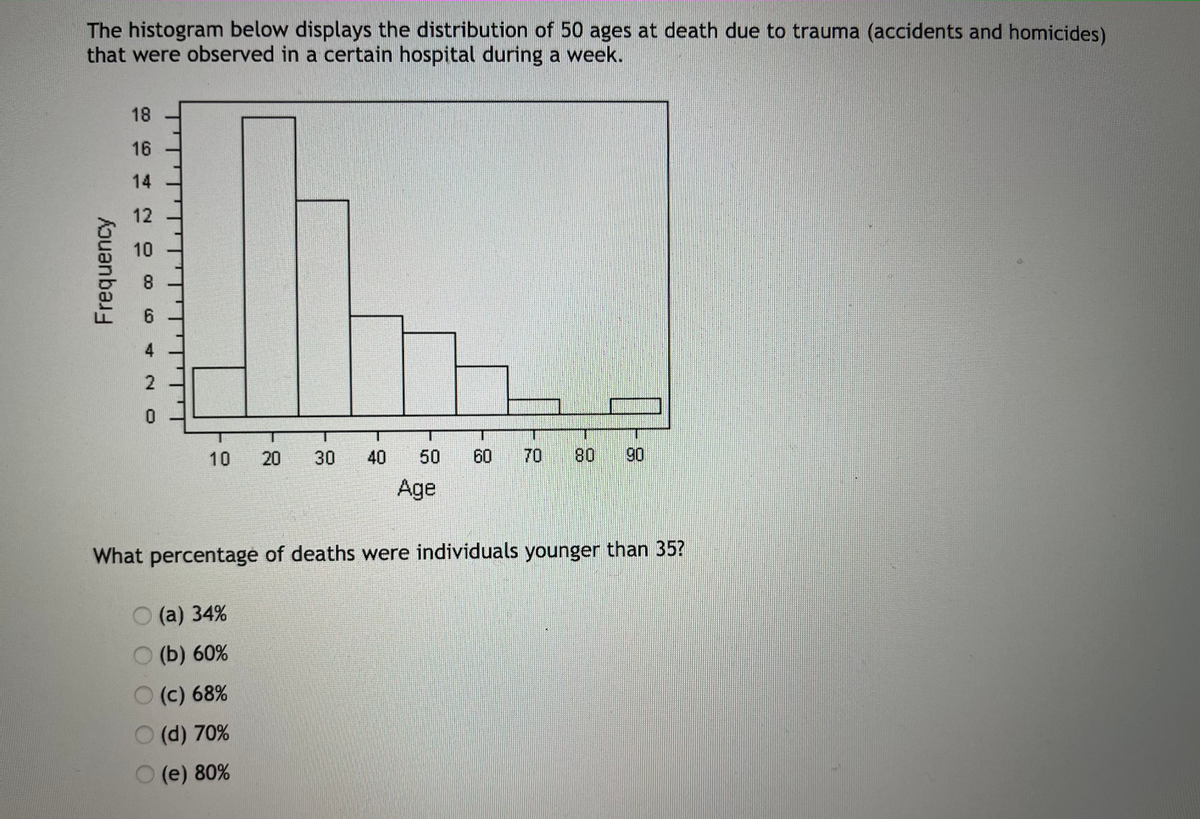
The histogram below displays the distribution of 50 ages at death due to trauma (accidents and homicides) that were observed in a certain hospital during a week. 18 16 14 12 10 30 40 50 60 70 80 90 Age What percentage of deaths were individuals younger than 35? (a) 34% (Б) 60% (c) 68% O (d) 70% (e) 80% Frequency 20
The histogram below displays the distribution of 50 ages at death due to trauma (accidents and homicides) that were observed in a certain hospital during a week. 18 16 14 12 10 30 40 50 60 70 80 90 Age What percentage of deaths were individuals younger than 35? (a) 34% (Б) 60% (c) 68% O (d) 70% (e) 80% Frequency 20

Glencoe Algebra 1, Student Edition, 9780079039897, 0079039898, 2018
18th Edition
ISBN:9780079039897
Author:Carter
Publisher:Carter
Chapter10: Statistics
Section10.1: Measures Of Center
Problem 9PPS

Related questions
Question
Transcribed Image Text:The histogram below displays the distribution of 50 ages at death due to trauma (accidents and homicides)
that were observed in a certain hospital during a week.
18
16
14
12
10
30
40
50
60
70
80
90
Age
What percentage of deaths were individuals younger than 35?
(a) 34%
(Б) 60%
(c) 68%
O (d) 70%
(e) 80%
Frequency
20
Expert Solution
This question has been solved!
Explore an expertly crafted, step-by-step solution for a thorough understanding of key concepts.

This is a popular solution!

Trending now
This is a popular solution!

Step by step
Solved in 2 steps with 2 images

Recommended textbooks for you
Glencoe Algebra 1, Student Edition, 9780079039897…
Algebra
ISBN:
9780079039897
Author:
Carter
Publisher:
McGraw Hill
Glencoe Algebra 1, Student Edition, 9780079039897…
Algebra
ISBN:
9780079039897
Author:
Carter
Publisher:
McGraw Hill