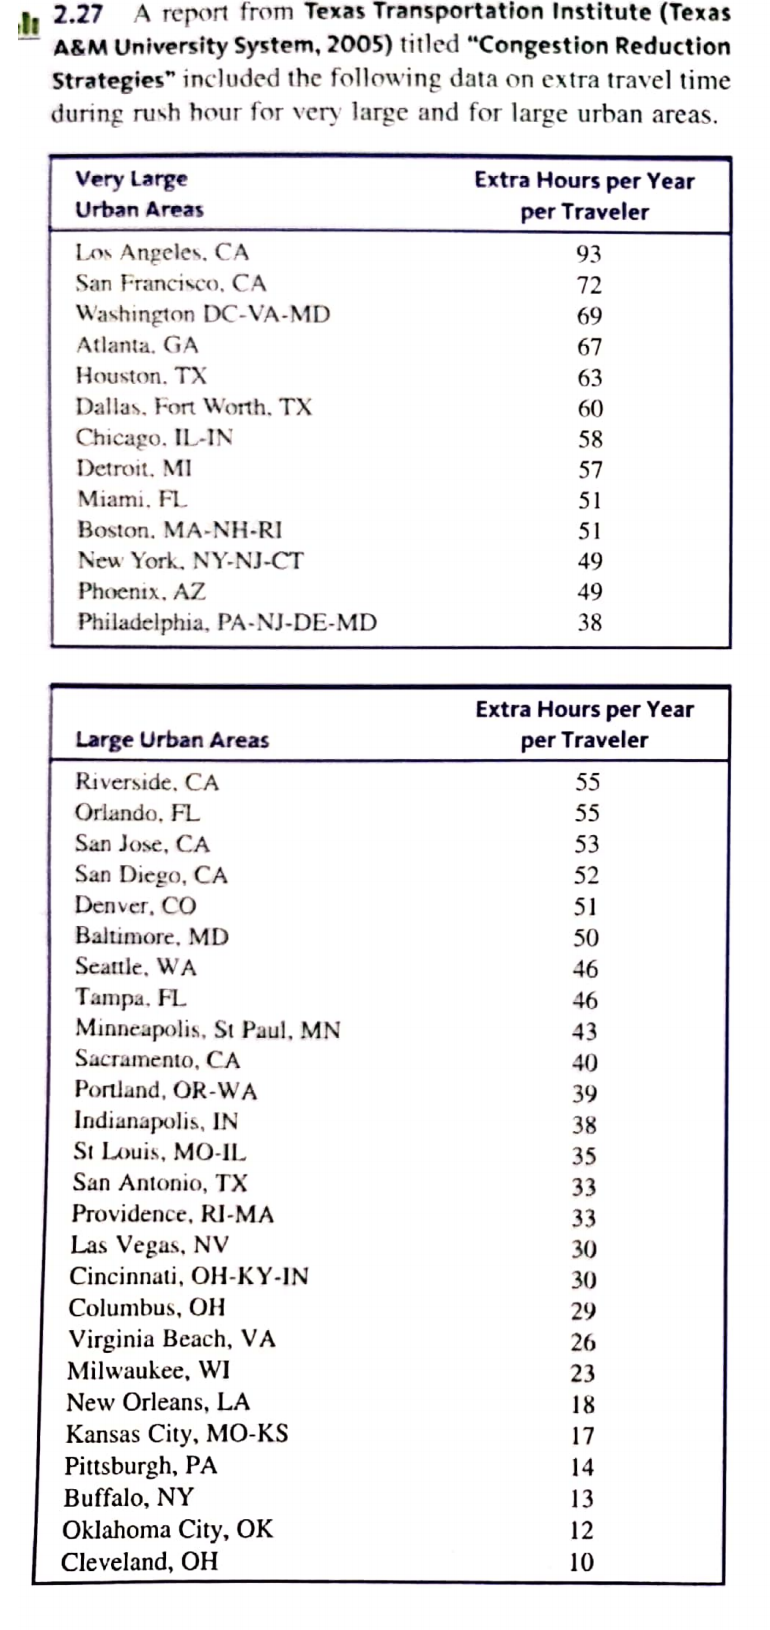
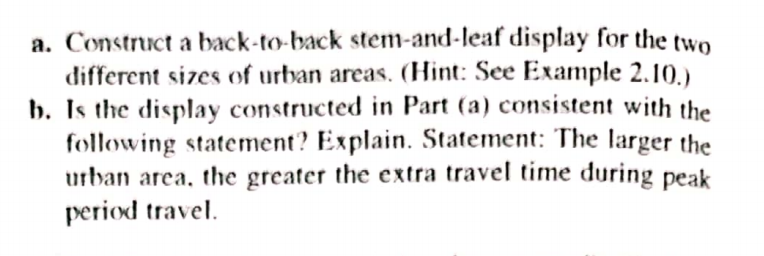
A report from Texas Transportation Institute (Texas A&M University System, 2005) titled "Congestion Reduction Strategies" included the following data on extra travel time during rush hour for very large and for large urban areas. 2.27 Very Large Urban Areas Extra Hours per Year per Traveler Los Angeles, CA 93 San Francisco, CA 72 Washington DC-VA-MD 69 Atlanta. GA 67 Houston. TX 63 Dallas, Fort Worth, TX 60 Chicago, IL-IN 58 Detroit, MI 57 Miami, FL 51 Boston, MA-NH-RI 51 New York, NY-NJ-CT 49 Phoenix, AZ 49 Philadelphia, PA-NJ-DE-MD 38 Extra Hours per Year Large Urban Areas per Traveler Riverside, CA 55 Orlando, FL 55 San Jose, CA 53 San Diego, CA Denver, CO 52 51 Baltimore, MD 50 Seattle, WA 46 Tampa, FL Minneapolis, St Paul, MN Sacramento, CA Portland, OR-WA 46 43 40 39 Indianapolis, IN St Louis, MO-IL 38 35 San Antonio, TX 33 Providence, RI-MA 33 Las Vegas, NV Cincinnati, OH-KY-IN 30 30 Columbus, OH 29 Virginia Beach, VA Milwaukee, WI New Orleans, LA 26 23 18 Kansas City, MO-KS 17 Pittsburgh, PA Buffalo, NY Oklahoma City, OK Cleveland, OH 14 13 12 10 a. Construct a back-to-back stem-and-leaf display for the two different sizes of urban areas. (Hint: See Example 2.10.) b. Is the display constructed in Part (a) consistent with the following statement? Explain. Statement: The larger the urban area, the greater the extra travel time during period travel. peak
A report from Texas Transportation Institute (Texas A&M University System, 2005) titled "Congestion Reduction Strategies" included the following data on extra travel time during rush hour for very large and for large urban areas. 2.27 Very Large Urban Areas Extra Hours per Year per Traveler Los Angeles, CA 93 San Francisco, CA 72 Washington DC-VA-MD 69 Atlanta. GA 67 Houston. TX 63 Dallas, Fort Worth, TX 60 Chicago, IL-IN 58 Detroit, MI 57 Miami, FL 51 Boston, MA-NH-RI 51 New York, NY-NJ-CT 49 Phoenix, AZ 49 Philadelphia, PA-NJ-DE-MD 38 Extra Hours per Year Large Urban Areas per Traveler Riverside, CA 55 Orlando, FL 55 San Jose, CA 53 San Diego, CA Denver, CO 52 51 Baltimore, MD 50 Seattle, WA 46 Tampa, FL Minneapolis, St Paul, MN Sacramento, CA Portland, OR-WA 46 43 40 39 Indianapolis, IN St Louis, MO-IL 38 35 San Antonio, TX 33 Providence, RI-MA 33 Las Vegas, NV Cincinnati, OH-KY-IN 30 30 Columbus, OH 29 Virginia Beach, VA Milwaukee, WI New Orleans, LA 26 23 18 Kansas City, MO-KS 17 Pittsburgh, PA Buffalo, NY Oklahoma City, OK Cleveland, OH 14 13 12 10 a. Construct a back-to-back stem-and-leaf display for the two different sizes of urban areas. (Hint: See Example 2.10.) b. Is the display constructed in Part (a) consistent with the following statement? Explain. Statement: The larger the urban area, the greater the extra travel time during period travel. peak

Linear Algebra: A Modern Introduction
4th Edition
ISBN:9781285463247
Author:David Poole
Publisher:David Poole
Chapter7: Distance And Approximation
Section7.3: Least Squares Approximation
Problem 31EQ

Related questions
Question
Transcribed Image Text:A report from Texas Transportation Institute (Texas
A&M University System, 2005) titled "Congestion Reduction
Strategies" included the following data on extra travel time
during rush hour for very large and for large urban areas.
2.27
Very Large
Urban Areas
Extra Hours per Year
per Traveler
Los Angeles, CA
93
San Francisco, CA
72
Washington DC-VA-MD
69
Atlanta. GA
67
Houston. TX
63
Dallas, Fort Worth, TX
60
Chicago, IL-IN
58
Detroit, MI
57
Miami, FL
51
Boston, MA-NH-RI
51
New York, NY-NJ-CT
49
Phoenix, AZ
49
Philadelphia, PA-NJ-DE-MD
38
Extra Hours per Year
Large Urban Areas
per Traveler
Riverside, CA
55
Orlando, FL
55
San Jose, CA
53
San Diego, CA
Denver, CO
52
51
Baltimore, MD
50
Seattle, WA
46
Tampa, FL
Minneapolis, St Paul, MN
Sacramento, CA
Portland, OR-WA
46
43
40
39
Indianapolis, IN
St Louis, MO-IL
38
35
San Antonio, TX
33
Providence, RI-MA
33
Las Vegas, NV
Cincinnati, OH-KY-IN
30
30
Columbus, OH
29
Virginia Beach, VA
Milwaukee, WI
New Orleans, LA
26
23
18
Kansas City, MO-KS
17
Pittsburgh, PA
Buffalo, NY
Oklahoma City, OK
Cleveland, OH
14
13
12
10
Transcribed Image Text:a. Construct a back-to-back stem-and-leaf display for the two
different sizes of urban areas. (Hint: See Example 2.10.)
b. Is the display constructed in Part (a) consistent with the
following statement? Explain. Statement: The larger the
urban area, the greater the extra travel time during
period travel.
peak
Expert Solution
This question has been solved!
Explore an expertly crafted, step-by-step solution for a thorough understanding of key concepts.

This is a popular solution!

Trending now
This is a popular solution!

Step by step
Solved in 2 steps

Recommended textbooks for you
Linear Algebra: A Modern Introduction
Algebra
ISBN:
9781285463247
Author:
David Poole
Publisher:
Cengage Learning

Glencoe Algebra 1, Student Edition, 9780079039897…
Algebra
ISBN:
9780079039897
Author:
Carter
Publisher:
McGraw Hill
Linear Algebra: A Modern Introduction
Algebra
ISBN:
9781285463247
Author:
David Poole
Publisher:
Cengage Learning
Glencoe Algebra 1, Student Edition, 9780079039897…
Algebra
ISBN:
9780079039897
Author:
Carter
Publisher:
McGraw Hill