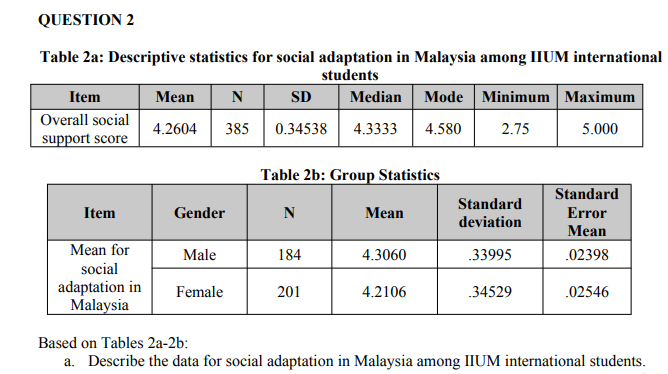
Based on Tables 2a-2b: a. Describe the data for social adaptation in Malaysia among IIUM international students.


Q: Assuming that the population variances from both offices are not equal, is there evidence of a…
A: Let sample 1 for Central Office I Time and sample 2 Central Office II Time. Given: n1 = 20, n2 = 20…
Q: Question 4 of 5 Sally is planning the school picnic and needs to decide what food vendor to use. She…
A:
Q: Define the population parameter in context in one sentence.
A: Here we have the given statement about the population parameter.
Q: Question 6 Points 1 Given the following contingency table for hair color and eye color of college…
A: We have given the data for the contingency table for hair color and eye color.
Q: Given data below, determine the following: LOCA- TION DATA 1 2 3 4 5 6 7 8 10 11 12 12.1 17.1 17.1…
A:
Q: Use the following description for Questions 1-3. A consumer products company uses direct mail…
A: 1) There are two factors Design and Region. So we can use Two way ANOVA model. Hence option C is the…
Q: Following are some data collection methods used in quantitative research except ONE;…
A: Quantitative research is done by collecting numerical data.
Q: Table 1: Significant difference in the Management Capability of Administrators When Grouped Gender…
A: From the given information, Null Hypothesis: H0: There is no significance difference in the…
Q: TABLE 2.6 Snake River Data for Problem 2.7 Y Y 23.1 10.5 32.8 16.7 31.8 18.2 32.0 17.0 30.4 16.3…
A: Hi! Thank you for the question, As per the honor code, we are allowed to answer three sub-parts at a…
Q: Passenger kilometres (pax-km) flown on Golden Airlines, a commuter firm serving the Johannesburg –…
A: “Since you have posted a question with multiple sub-parts, we will solve first three subparts for…
Q: QUESTIONS 11-15. Data in the table below were collected in a 10-year prospective cohort study of…
A: status Exposed noExposed meso 20 2 no meso 980 9998
Q: QUESTION 2 Banila Co. selected 1,000 young adults at random and surveyed them to determine a…
A: I can only answer one question and only solve first 3 sub parts of the question. This is guidelines…
Q: City Hotel Room Rate ($) Entertainment ($) Boston 144 161 Denver 96 103 Nashville 88 103…
A: Solution: given data City Hotel Room Rate ($) Entertainment ($) Boston 144 161 Denver 96 103…
Q: (a) Identify the population of interest and the sample in this study. (b) Comment on whether or not…
A: Part a) This part is asked to find Population of interest and the sample in this study. Note that ,…
Q: Question 11. Healthcare workers are at risk of being exposed to blood-borne pathogens through…
A: To check the Paired test or unpaired test The Paired t-Test compares two means that are from the…
Q: A problem with a phone line that prevents a customer from receiving or making calls is upsetting to…
A: Note : As per guidelines we are supposed to solve only one question at a time .Please repost the…
Q: Question 1 of 10 Consider the graphs below. What are the response variables? Temperature Time Length…
A: A response variable is a variable whose variation depends on the other variables. This means the…
Q: The data refer to the glucose level of 60 children: 56 61 57 77 62 75 63 55 64 60 60 57 61 57 67 62…
A: Given data : 56 ,61, 57, 77, 62, 75, 63, 55, 64, 60, 60, 57, 61, 57, 67, 62, 69, 67, 68, 59, 65, 72,…
Q: For the following calculations, use the results in column (3) of Table 13.2.Consider two classrooms,…
A:
Q: QUESTION 22 For the given data in stem-and- leaf display form, find the inter-quartile range 2 | 15…
A: Given data,…
Q: A problem with a phone line that prevents a customer from receiving or making calls is upsetting to…
A:
Q: complete
A: Hi! Thank you for the question, As per the honor code, we are allowed to answer three sub-parts at a…
Q: Section 1-Question 13 Jennifer asked 50 students if they preferred dogs or cats. The table shows the…
A:
Q: Calculate SStotal, SSbetween, and SSwithin for the following set of data: Treatment 1 Treatment 2…
A: Given, Treatment 1 Treatment 2 Treatment 3 n=5 n=5 n=5 N=15 T=10 T=15 T=35 G=60 SS=21…
Q: The article "Estimating Population Abundance in Plant Species with Dormant Life-Stages: Fire and the…
A: "Since you have posted a question with multiple sub-parts, we will solve first three sub-parts for…
Q: QUESTION 1 Use the following description for Questions 1-3. A consumer products company uses…
A: Two way ANOVA : The two-way analysis of variance is a statistical extension of the one-way analysis…
Q: QUESTION 4 The following table shows the cross-classification of accounting practices (either…
A: Hi! Thank you for the question, As per the honor code, we are allowed to answer three sub-parts at a…
Q: A city council voted to conduct a study on inner city community problems. A nearby univers was…
A: let there be x sociologists and y be the number of research assistants the objective is to minimize…
Q: TABLE 8.7. Number of days meeting an exercise goal Condition n Mean St.Dev. Praise 70 30.0 32.0…
A: A. The test statistic for comparing the pairs of groups is,
Q: Table 2 Department Mean SD CoefVar Min Q1 Median Q3 Max IQR Skewness Finance 6.052…
A: Skewness: A frequency distribution of the set of values that is not symmetrical or normal is called…
Q: Question 3 a. Management of a nationwide Australian bank organised for a survey of its clients to…
A: Sample Size, n = 2,500 Of the completed surveys, 875 indicated that the client was satisfied with…
Q: Briefly compare the properties of the AR(1) and MA(1) models, discussing their relative advantages…
A: Given information: The investigator is specially interested to compare the properties of Auto…
Q: COLUMN A 11. What Effect do Punitive Behavioural Control Statements have on Classroom? 12. The…
A: Introduction - Anthropology is the study of what makes us human . Anthropologists take a broad…
Q: Question 11 Stacey Davis, chairman of a college's business department, has decided to assign…
A:
Q: The data shows a sample of states' percentage of public high school graduation rates for a recent…
A: Arrange the given data in ascending order63, 72, 72, 75, 75, 78, 81, 84, 85, 86, 89, 90, 92, 92, 93,…
Q: What is the following table called?
A: It is given that A table which contains some intervals with number of values in these intervals.
Q: QUESTION 9 Construct a stem-and-leaf display for the following data. Specify the leaf unit for the…
A: Given data, 12,52,51,37,47,40,38,26,57,31,49,43,45,19,36,32,44,48,22,18 Sort the data in ascending…
Q: TABLE 4| The risk of low academic self-efficacy among students. Model 1 Model 2 Model 3 Model 4…
A: Given information: Dependent variable = Academic self-efficacy Independent variables: Symptoms of…
Q: Eleven sets of fraternal twins are tracked to see the number of years of education the results are…
A:
Q: Question 4: The following data includes the year, make, model, mileage (in thousands of miles) and…
A:
Q: Create a five-number summary of the data set. minimum %3D mpge mpge median = mpge Q3 = mpge maximum…
A:
Q: Given are the two sets of data on geometry first quarter test scores of two sections in grade 10:]…
A: Mean is the measure of central tendency. It is calculated by adding all the observation divided by…
Q: Product Information for 10 Tablet Computers Cost Operating Display Size Battery Life (inches) CPU…
A: The percentage of favorable outcomes can be given by the product of the ratio of number of favorable…
Q: Question 1 150 steel workshops have the following distribution of average number of workers in varic…
A: Given data, Find the mean salary paid to workers?
Q: The following data give the numbers of orders received for a sample of 30 items at the Time-saver…
A: The median for the dataset is the data point which divides the data set in two equal halves. It lies…
Q: elow is the study time data for 65 students (BBA213) at Cavendish University of Zambia. This data is…
A: Given data, Data 16 20 33 24 36 14 16 17 36 22 15 10 18 45 15 16…
Q: What is the ratio of deaths from gastroenteritis to heart disease in the total population, and in…
A: Given Data :
Q: Question 16 The shopping times (in m stem-and-leaf diagram bel-
A: From given stem leaf, the data is…
Q: Question# 3: Consumption of Natural Gas: Following data represents the energy consumption of natural…
A: Hello. Since your question has multiple parts, we will solve first question for you. If you want…
Q: Question 2 A car loans officer of a large commercial bank wishes to determine whether the amount of…
A: Hi! Thank you for the question, As per the honor code, we are allowed to answer three sub-parts at a…

Contingency Table
A contingency table can be defined as the visual representation of the relationship between two or more categorical variables that can be evaluated and registered. It is a categorical version of the scatterplot, which is used to investigate the linear relationship between two variables. A contingency table is indeed a type of frequency distribution table that displays two variables at the same time.
Binomial Distribution
Binomial is an algebraic expression of the sum or the difference of two terms. Before knowing about binomial distribution, we must know about the binomial theorem.

Step by step
Solved in 3 steps


- question 4 Chen et al. (2000) examined the foraging behaviour of northern elephant seals (Mirounga angustirostris) that breed along the west coast of Mexico and the USA. They attached platform satellite transmitter terminals (PTTs) to 22 male seals and recorded, for each seal, the distance (km) to its main feeding area offshore and the amount of time (days) it spent at the feeding area. The results are presented below: What two null hypotheses are being tested with the output shown above? What statistical conclusions would you draw about these hypotheses? Complete the regression equation by filling in the blanks (to the nearest 3 decimal places). duration = + * distance What is one biological interpretation of this relationship between duration and distance ? What % of the variation in duration at main feeding area was explained by distance to feeding area?Question #4. US Universities found that 72% of people are concerned about the possibility that their personal records could be stolen over the Internet. If a random sample of 300 college students at a Midwestern university were taken and 228 of them were concerned about the possibility that their personal records could be stolen over the Internet, could you conclude at the 0.025 level of significance that a higher proportion of the university's college students are concerned about Internet theft than the public at large? Report the p-value for this test. Z0.025 = 1.96QUESTION 3 The Research Unit for Cecilion Supermart conducted an experiment to estimate the strength of thecarrier bag from the starch-based biofilms made from two different jicamas (sengkuang) of type Aand type B. However, the researcher claims that jicama type A produces more strength comparedto type B. To support this claim, 10kg weight item was put into 100 carrier bags made from jicamatype A and 200 carrier bags made from jicama type B were randomly selected. As a result, 8 bagsfrom jicama type A burst while 12 bags from jicama type B burst. Calculate a 95% confidenceinterval for the difference in true proportion of the carrier bags which burst between jicama type Aand type B. Give comment on the parameter estimate.
- Question# 4: French Biscuit Manufacturer (FBM), produces two types of biscuits (i) double chocolate biscuits and (ii) tea time biscuits in two separate manufacturing units. They are interested in expanding the manufacturing units (one by one) because there is a demand in the market but facing a difficulty to decide which manufacturing unit should expand first. Company officials decided that the expansion decision was based upon monthly demand. FBM official consults you and requests to give your valuable suggestion which will be helpful for final decision. you analyzed the following normally distributed data: Monthly Sale of Biscuits Double Chocolate 8551 6314 5259 8138 8429 4807 8025 6845 6478 7513 9125 4894 9106 8775 10070 7845 6229 8459 10542 4196 Tea Time 10247 6601 7404 8919 9255 8404 6304 7803 11474 9131 13345 8118 6713 7439 10957 12098 9134 7535 10316 8125 Kindly provide the…Question # 4 French Biscuit Manufacturer (FBM), produces two types of biscuits (i) double chocolate biscuits and (ii) tea time biscuits in two separate manufacturing units. They are interested in expanding the manufacturing units (one by one) because there is a demand in the market but facing a difficulty to decide which manufacturing unit should expand first. Company officials decided that the expansion decision was based upon monthly demand. FBM official consults you and requests to give your valuable suggestion which will be helpful for final decision. you analyzed the following normally distributed data: Monthly Sale of Biscuits Double Chocolate 8551 6314 5259 8138 8429 4807 8025 6845 6478 7513 9125 4894 9106 8775 10070 7845 6229 8459 10542 4196 Tea Time 10247 6601 7404 8919 9255 8404 6304 7803…Question # 4 French Biscuit Manufacturer (FBM), produces two types of biscuits (i) double chocolate biscuits and (ii) tea time biscuits in two separate manufacturing units. They are interested in expanding the manufacturing units (one by one) because there is a demand in the market but facing a difficulty to decide which manufacturing unit should expand first. Company officials decided that the expansion decision was based upon monthly demand. FBM official consults you and requests to give your valuable suggestion which will be helpful for final decision. you analyzed the following normally distributed data: Monthly Sale of Biscuits Double Chocolate 8551 6314 5259 8138 8429 4807 8025 6845 6478 7513 9125 4894 9106 8775 10070 7845 6229 8459 10542 4196 Tea Time 10247 6601 7404 8919 9255 8404 6304 7803 11474 9131 13345 8118 6713 7439 10957 12098 9134 7535…
- Question# 4: French Biscuit Manufacturer (FBM), produces two types of biscuits (i) double chocolate biscuits and (ii) tea time biscuits in two separate manufacturing units. They are interested in expanding the manufacturing units (one by one) because there is a demand in the market but facing a difficulty to decide which manufacturing unit should expand first. Company officials decided that the expansion decision was based upon monthly demand. FBM official consults you and requests to give your valuable suggestion which will be helpful for final decision. you analyzed the following normally distributed data: Monthly Sale of Biscuits Double Chocolate 8551 6314 5259 8138 8429 4807 8025 6845 6478 7513 9125 4894 9106 8775 10070 7845 6229 8459 10542 4196 Tea Time 10247 6601 7404 8919 9255 8404 6304 7803 11474 9131 13345 8118 6713 7439 10957 12098 9134 7535 10316 8125 NEED BELOW PENDING…Question 7 Consider a cohort study to compare the mortality rate of myocardial infarction (MI) in men with sedentary work (exposed group) to men with physically active work (unexposed). If in the exposed, there were 36,000 person (man) years of observation and 126 deaths whereas the unexposed had 24,000 man-years of observation and 44 deaths. Compute the following a) Mortality rate in each cohort? b) What is the relative risk of dying, comparing these 2 groups? c) What is the attributable risk of sedentary work? d) What is the attributable benefit of physical activity? e) If we assume that MI is associated with the mortality in this cohort (causality), what proportion of the disease in the higher group is potentially preventable?Question 17: A well-known brokerage firm executive claimed that 90% of investors are currently confident of meeting their investment goals. An XYZ Investor Optimism Survey, conducted over a two week period, found that in a sample of 100 people, 81% of them said they are confident of meeting their goals.Test the claim that the proportion of people who are confident is smaller than 90% at the 0.05 significance level.The null and alternative hypothesis would be: H0:p≤0.9H0:p≤0.9H1:p>0.9H1:p>0.9 H0:μ≤0.9H0:μ≤0.9H1:μ>0.9H1:μ>0.9 H0:μ≥0.9H0:μ≥0.9H1:μ<0.9H1:μ<0.9 H0:μ=0.9H0:μ=0.9H1:μ≠0.9H1:μ≠0.9 H0:p=0.9H0:p=0.9H1:p≠0.9H1:p≠0.9 H0:p≥0.9H0:p≥0.9H1:p<0.9H1:p<0.9 The test is: two-tailed right-tailed left-tailed The test statistic is: (to 3 decimals)The p-value is: (to 4 decimals)Based on this we: Fail to reject the null hypothesis Reject the null hypothesis
- Question 4It is believed that the mean rental price of properties in area 2 is higher than that in area 1. A sample of 300 properties in area1 and 250 properties in area 2 are collected. An independent samples t-test is used to compare the mean rental price of two areas. Table 3 displays the independent samples t-test output. Table 3: Output of an independent sample t-test Area 1 Area 2Mean 194.93 240.84Variance 652.50 2773.19Observations 300 250Hypothesized Mean Difference 0.00df 345.00t Stat -12.60P(T<=t) one-tail 0.001t Critical one-tail 1.65P(T<=t) two-tail 0.002t Critical two-tail 1.97 1) Give appropriate null and alternative hypotheses.Null hypothesis H 0 Alternative hypothesis H 1 2) Find the p value for this test.3) The alpha level is set at 0.05, what decision should be made about the hypotheses. Give evidence for your choice.A paper investigated the driving behavior of teenagers by observing their vehicles as they left a high school parking lot and then again at a site approximately 1 2 mile from the school. Assume that it is reasonable to regard the teen drivers in this study as representative of the population of teen drivers. Amount by Which Speed Limit Was Exceeded MaleDriver FemaleDriver 1.2 -0.1 1.4 0.4 0.9 1.1 2.1 0.7 0.7 1.1 1.3 1.2 3 0.1 1.3 0.9 0.6 0.5 2.1 0.5 (a) Use a .01 level of significance for any hypothesis tests. Data consistent with summary quantities appearing in the paper are given in the table. The measurements represent the difference between the observed vehicle speed and the posted speed limit (in miles per hour) for a sample of male teenage drivers and a sample of female teenage drivers. (Use μmales − μfemales.Round your test statistic to two decimal places. Round your degrees of freedom down to the nearest whole number. Round your p-value to…A paper investigated the driving behavior of teenagers by observing their vehicles as they left a high school parking lot and then again at a site approximately 1 2 mile from the school. Assume that it is reasonable to regard the teen drivers in this study as representative of the population of teen drivers. Amount by Which Speed Limit Was Exceeded MaleDriver FemaleDriver 1.3 -0.1 1.3 0.4 0.9 1.1 2.1 0.7 0.7 1.1 1.3 1.2 3 0.1 1.3 0.9 0.6 0.5 2.1 0.5 (a) Use a .01 level of significance for any hypothesis tests. Data consistent with summary quantities appearing in the paper are given in the table. The measurements represent the difference between the observed vehicle speed and the posted speed limit (in miles per hour) for a sample of male teenage drivers and a sample of female teenage drivers. (Use μmales − μfemales.Round your test statistic to two decimal places. Round your degrees of freedom down to the nearest whole number. Round your p-value to…