Step 2: Enter the test statistic. (Round to 3 decimal places.) 03- 1.087 02- Step 3: Shade the area represented by the p-value. Area = 0.8615 0.1- Area = 0.8615 Step 4: Enter the p-value. (Round to 3 decimal places.) 1.723 2--1.087 2=1.087 (d) Based on your answer to part (c), choose what can be concluded, at the 0.10 level of significance, about your claim. O Since the p-value is less than (or equal to) the level of significance, the null hypothesis is rejected. So, there is enough evidence to support the claim that the percentage of software engineers who rate the company they work for as "a great place to work" is not 87%. O Since the p-value is less than (or equal to) the level of significance, the null hypothesis is not rejected. So, there is not enough evidence to support the claim that the percentage of software engineers who rate the company they work for as "a great place to work" is not 87%. O Since the p-value is greater than the level of significance, the null hypothesis is rejected. So, there is enough evidence to support the claim that the percentage of software engineers who rate the company they work for as "a great place to work" is not 87%. O Since the p-value is greater than the level of significance, the null hypothesis is not rejected. So, there is not enough Explanation Check Acc Terms of Use Privacy Center O 2021 McGraw Hill LLC. AllRights Reserved.
Step 2: Enter the test statistic. (Round to 3 decimal places.) 03- 1.087 02- Step 3: Shade the area represented by the p-value. Area = 0.8615 0.1- Area = 0.8615 Step 4: Enter the p-value. (Round to 3 decimal places.) 1.723 2--1.087 2=1.087 (d) Based on your answer to part (c), choose what can be concluded, at the 0.10 level of significance, about your claim. O Since the p-value is less than (or equal to) the level of significance, the null hypothesis is rejected. So, there is enough evidence to support the claim that the percentage of software engineers who rate the company they work for as "a great place to work" is not 87%. O Since the p-value is less than (or equal to) the level of significance, the null hypothesis is not rejected. So, there is not enough evidence to support the claim that the percentage of software engineers who rate the company they work for as "a great place to work" is not 87%. O Since the p-value is greater than the level of significance, the null hypothesis is rejected. So, there is enough evidence to support the claim that the percentage of software engineers who rate the company they work for as "a great place to work" is not 87%. O Since the p-value is greater than the level of significance, the null hypothesis is not rejected. So, there is not enough Explanation Check Acc Terms of Use Privacy Center O 2021 McGraw Hill LLC. AllRights Reserved.

College Algebra (MindTap Course List)
12th Edition
ISBN:9781305652231
Author:R. David Gustafson, Jeff Hughes
Publisher:R. David Gustafson, Jeff Hughes
Chapter8: Sequences, Series, And Probability
Section8.7: Probability
Problem 6E: List the sample space of each experiment. Tossing three coins

Related questions
Question
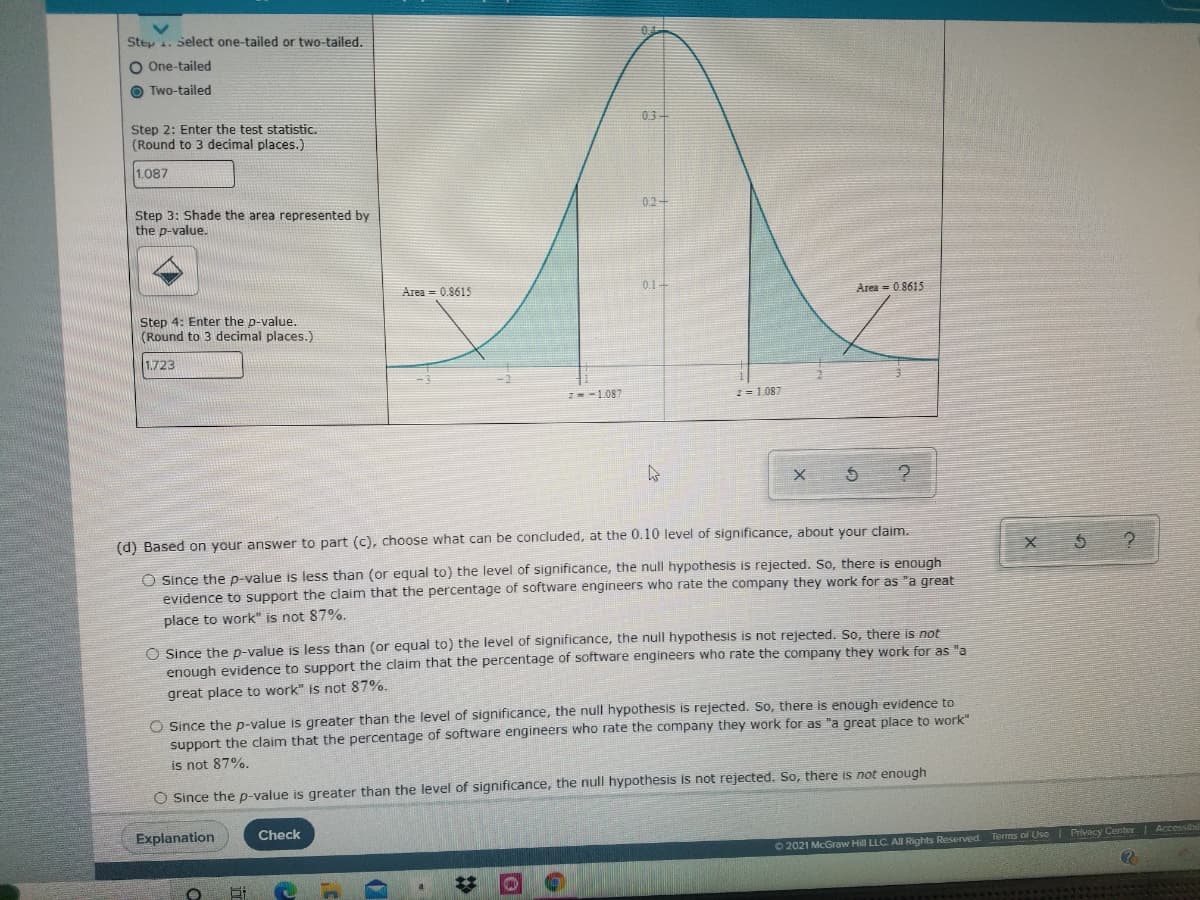
Transcribed Image Text:Step . Select one-tailed or two-tailed.
O One-tailed
O Two-tailed
Step 2: Enter the test statistic.
(Round to 3 decimal places.)
03-
1.087
02+
Step 3: Shade the area represented by
the p-value.
Area = 0.8615
0.1-
Area = 0.8615
Step 4: Enter the p-value,
(Round to 3 decimal places.)
1.723
Z--1.087
2 = 1.087
(d) Based on your answer to part (c), choose what can be concluded, at the 0.10 level of significance, about your claim.
X
O Since the p-value is less than (or equal to) the level of significance, the null hypothesis is rejected. So, there is enough
evidence to support the claim that the percentage of software engineers who rate the company they work for as "a great
place to work" is not 87%.
O Since the p-value is less than (or equal to) the level of significance, the null hypothesis is not rejected. So, there is not
enough evidence to support the claim that the percentage of software engineers who rate the company they work for as "a
great place to work" is not 87%.
O Since the p-value is greater than the level of significance, the null hypothesis is rejected. So, there is enough evidence to
support the claim that the percentage of software engineers who rate the company they work for as "a great place to work"
is not 87%.
O Since the p-value is greater than the level of significance, the null hypothesis is not rejected. So, there is not enough
Explanation
Check
O2021 McGraw Hill LLC. All Rights Reserved.
Terms of Use | Privacy Center Accessibi
%23
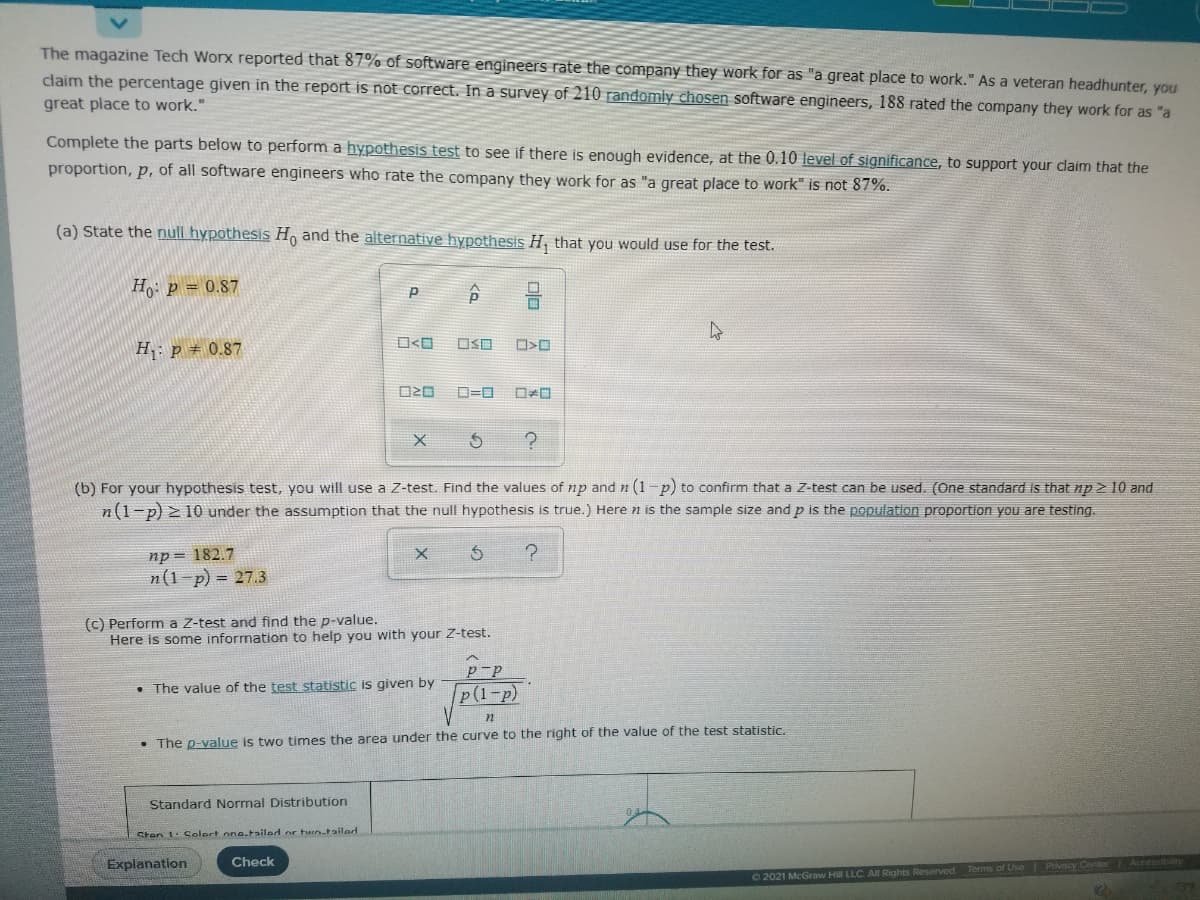
Transcribed Image Text:The magazine Tech Worx reported that 87% of software engineers rate the company they work for as "a great place to work." As a veteran headhunter, you
claim the percentage given in the report is not correct. In a survey of 210 randomly chosen software engineers, 188 rated the company they work for as "a
great place to work."
Complete the parts below to perform a hypothesis test to see if there is enough evidence, at the 0.10 level of significance, to support your claim that the
proportion, p, of all software engineers who rate the company they work for as "a great place to work" is not 87%.
(a) State the null hypothesis H, and the alternative hypothesis H, that you would use for the test.
H: p = 0.87
O<O
OSO
H: p + 0.87
D20
D=0
(b) For your hypothesis test, you will use a Z-test. Find the values of np and n (1-p) to confirm that a Z-test can be used. (One standard is that np > 10 and
n(1-p) > 10 under the assumption that the null hypothesis is true.) Here n is the sample size and p is the population proportion you are testing.
np = 182.7
n(1-p) = 27.3
(c) Perform a Z-test and find the p-value.
Here is some information to help you with your Z-test.
p-p
• The value of the test statistic is given by
p(1-p)
V
• The p-value is two times the area under the curve to the right of the value of the test statistic.
Standard Normal Distribution
Sten 1. Colart ona.tailad or tun-tailad
Explanation
Check
Terms of Use Privscy Center Actessibliny
O2021 McGraw Hill LLC. Al Rights Reserved
Expert Solution
This question has been solved!
Explore an expertly crafted, step-by-step solution for a thorough understanding of key concepts.

This is a popular solution!

Trending now
This is a popular solution!

Step by step
Solved in 2 steps with 2 images

Recommended textbooks for you
College Algebra (MindTap Course List)
Algebra
ISBN:
9781305652231
Author:
R. David Gustafson, Jeff Hughes
Publisher:
Cengage Learning

College Algebra (MindTap Course List)
Algebra
ISBN:
9781305652231
Author:
R. David Gustafson, Jeff Hughes
Publisher:
Cengage Learning