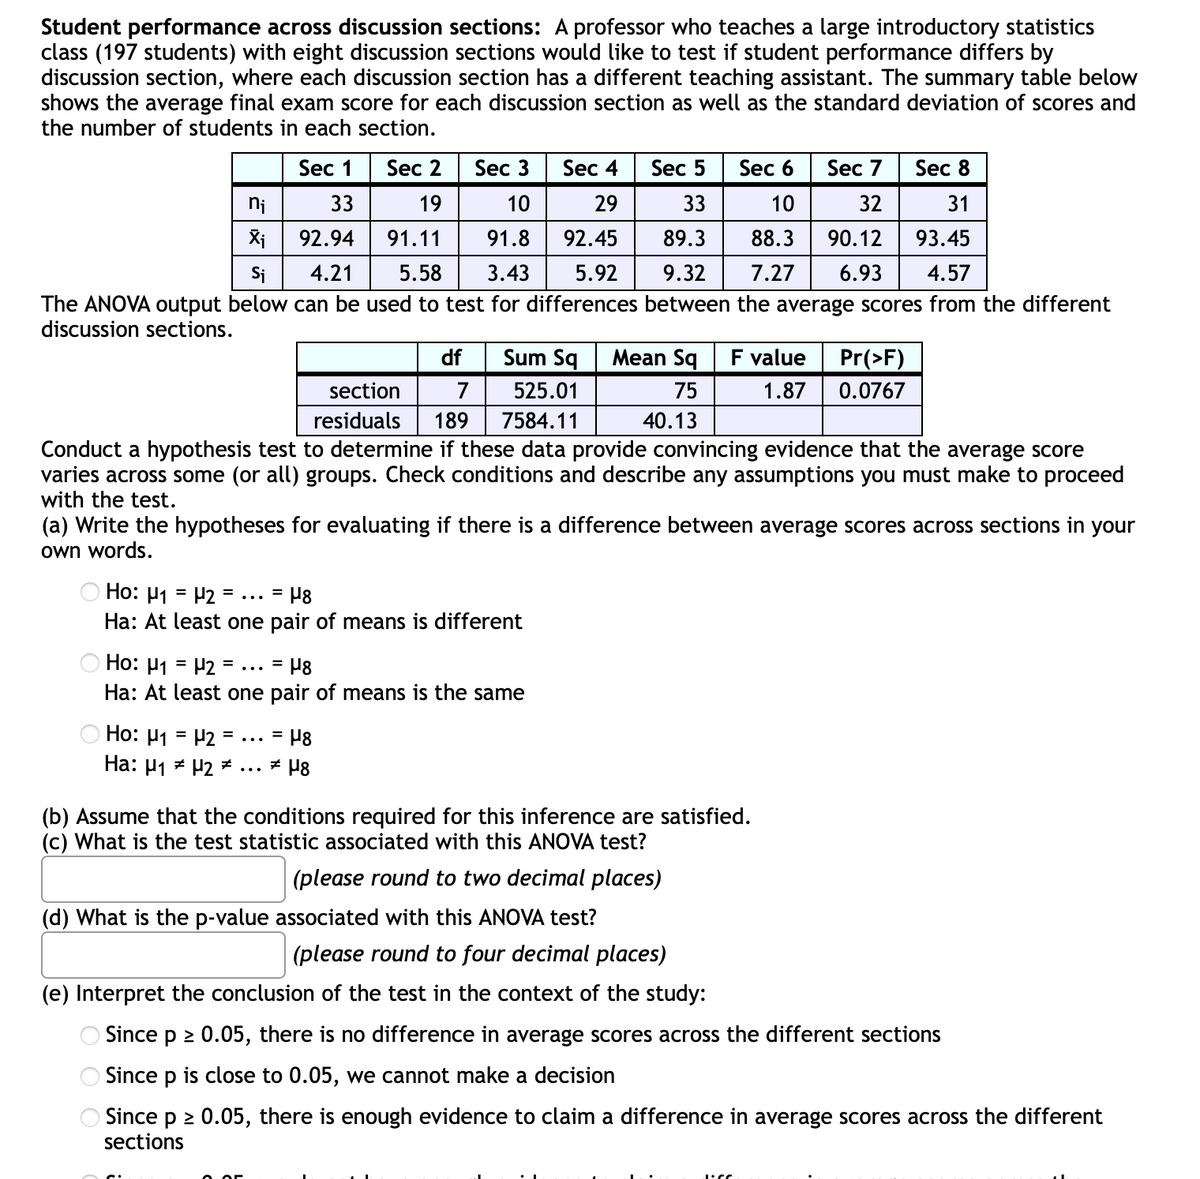
Student performance across discussion sections: A professor who teaches a large introductory statistics class (197 students) with eight discussion sections would like to test if student performance differs by discussion section, where each discussion section has a different teaching assistant. The summary table below shows the average final exam score for each discussion section as well as the standard deviation of scores and the number of students in each section. Sec 1 Sec 2 Sec 3 Sec 4 Sec 5 Sec 6 Sec 7 Sec 8 ni 33 19 10 29 33 10 32 31 Xi 92.94 91.11 91.8 92.45 89.3 88.3 90.12 93.45 Si 4.21 5.58 3.43 5.92 9.32 7.27 6.93 4.57 The ANOVA output below can be used to test for differences between the average scores from the different discussion sections. df Sum Sq Mean Sq F value Pr(>F) section 7 525.01 75 1.87 0.0767 residuals 189 7584.11 40.13 Conduct a hypothesis test to determine if these data provide convincing evidence that the average score varies across some (or all) groups. Check conditions with the test. (a) Write the hypotheses for evaluating if there is a difference between average scores across sections in your own words. lescribe any assumptions you must make to proceed Ho: H1 = P2 = ... = P8 Ha: At least one pair of means is different O Ho: P1 = P2 = ... = P8 Ha: At least one pair of means is the same O Ho: H1 = P2 = ... = P8 Ha: µ1 z P2 * ... * µ8 (b) Assume that the conditions required for this inference are satisfied. (c) What is the test statistic associated with this ANOVA test? |(please round to two decimal places) (d) What is the p-value associated with this ANOVA test?
Student performance across discussion sections: A professor who teaches a large introductory statistics class (197 students) with eight discussion sections would like to test if student performance differs by discussion section, where each discussion section has a different teaching assistant. The summary table below shows the average final exam score for each discussion section as well as the standard deviation of scores and the number of students in each section. Sec 1 Sec 2 Sec 3 Sec 4 Sec 5 Sec 6 Sec 7 Sec 8 ni 33 19 10 29 33 10 32 31 Xi 92.94 91.11 91.8 92.45 89.3 88.3 90.12 93.45 Si 4.21 5.58 3.43 5.92 9.32 7.27 6.93 4.57 The ANOVA output below can be used to test for differences between the average scores from the different discussion sections. df Sum Sq Mean Sq F value Pr(>F) section 7 525.01 75 1.87 0.0767 residuals 189 7584.11 40.13 Conduct a hypothesis test to determine if these data provide convincing evidence that the average score varies across some (or all) groups. Check conditions with the test. (a) Write the hypotheses for evaluating if there is a difference between average scores across sections in your own words. lescribe any assumptions you must make to proceed Ho: H1 = P2 = ... = P8 Ha: At least one pair of means is different O Ho: P1 = P2 = ... = P8 Ha: At least one pair of means is the same O Ho: H1 = P2 = ... = P8 Ha: µ1 z P2 * ... * µ8 (b) Assume that the conditions required for this inference are satisfied. (c) What is the test statistic associated with this ANOVA test? |(please round to two decimal places) (d) What is the p-value associated with this ANOVA test?

Glencoe Algebra 1, Student Edition, 9780079039897, 0079039898, 2018
18th Edition
ISBN:9780079039897
Author:Carter
Publisher:Carter
Chapter10: Statistics
Section10.4: Distributions Of Data
Problem 19PFA

Related questions

Question
Transcribed Image Text:Student performance across discussion sections: A professor who teaches a large introductory statistics
class (197 students) with eight discussion sections would like to test if student performance differs by
discussion section, where each discussion section has a different teaching assistant. The summary table below
shows the average final exam score for each discussion section as well as the standard deviation
the number of students in each section.
Scores and
Sec 1
Sec 2
Sec 3
Sec 4
Sec 5
Sec 6
Sec 7
Sec 8
ni
33
19
10
29
33
32
31
92.94
91.11
91.8
92.45
89.3
88.3
90.12
93.45
Si
4.21
5.58
3.43
5.92
9.32
7.27
6.93
4.57
The ANOVA output below can be used to test for differences between the average scores from the different
discussion sections.
df
Sum Sq
Mean Sq
F value
Pr(>F)
section
525.01
75
1.87
0.0767
residuals
189
7584.11
40.13
Conduct a hypothesis test to determine if these data provide convincing evidence that the average score
varies across some (or all) groups. Check conditions and describe any assumptions you must make to proceed
with the test.
(a) Write the hypotheses for evaluating if there is a difference between average scores across sections in your
own words.
Ho: µ1 = P2 = ... = P8
Ha: At least one pair of means is different
O Ho: H1 = H2 =
Ha: At least one pair of means is the same
= P8
...
Ho: µ1 = P2 = ...
= H8
%3D
Ha: µ1 z P2 ² ...
(b) Assume that the conditions required for this inference are satisfied.
(c) What is the test statistic associated with this ANOVA test?
(please round to two decimal places)
(d) What is the p-value associated with this ANOVA test?
(please round to four decimal places)
(e) Interpret the conclusion of the test in the context of the study:
O Since p 2 0.05, there is no difference in average scores across the different sections
O Since p is close to 0.05, we cannot make a decision
OSince p 2 0.05, there is enough evidence to claim a difference in average scores across the different
sections
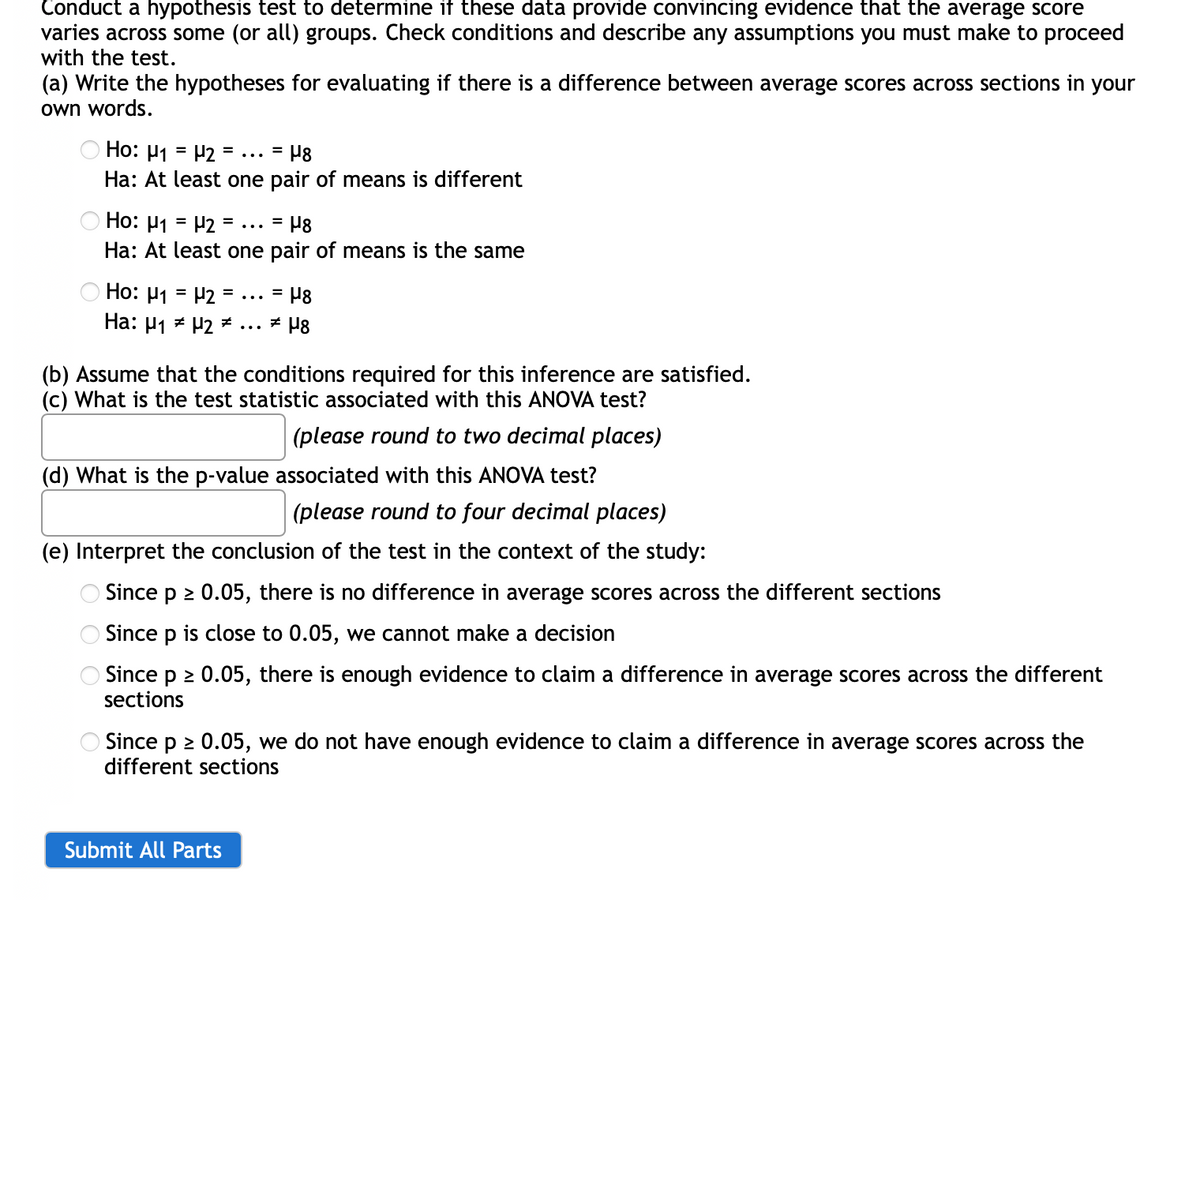
Transcribed Image Text:Conduct a hypothesis test to determine if these data provide convincing evidence that the average score
varies across some (or all) groups. Check conditions and describe any assumptions you must make to proceed
with the test.
(a) Write the hypotheses for evaluating if there is a difference between average scores across sections in your
own words.
O Ho: H1 = H2 =
%3D
=
...
Ha: At least one pair of means is different
Ho: µ1 = P2 = ... = P8
Ha: At least one pair of means is the same
Ho: µ1 = P2 = ... = P8
Ha: µ1 * P2 * ... ± µ8
(b) Assume that the conditions required for this inference are satisfied.
(c) What is the test statistic associated with this ANOVA test?
(please round to two decimal places)
(d) What is the p-value associated with this ANOVA test?
(please round to four decimal places)
(e) Interpret the conclusion of the test in the context of the study:
OSince p 2 0.05, there is no difference in average scores across the different sections
Since p is close to 0.05, we cannot make a decision
OSince p 2 0.05, there is enough evidence to claim a difference in average scores across the different
sections
O Since p 2 0.05, we do not have enough evidence to claim a difference in average scores across the
different sections
Submit All Parts
O O
Expert Solution
This question has been solved!
Explore an expertly crafted, step-by-step solution for a thorough understanding of key concepts.

This is a popular solution!

Trending now
This is a popular solution!

Step by step
Solved in 2 steps

Knowledge Booster


Learn more about
Need a deep-dive on the concept behind this application? Look no further. Learn more about this topic, statistics and related others by exploring similar questions and additional content below.Recommended textbooks for you
Glencoe Algebra 1, Student Edition, 9780079039897…
Algebra
ISBN:
9780079039897
Author:
Carter
Publisher:
McGraw Hill
Glencoe Algebra 1, Student Edition, 9780079039897…
Algebra
ISBN:
9780079039897
Author:
Carter
Publisher:
McGraw Hill