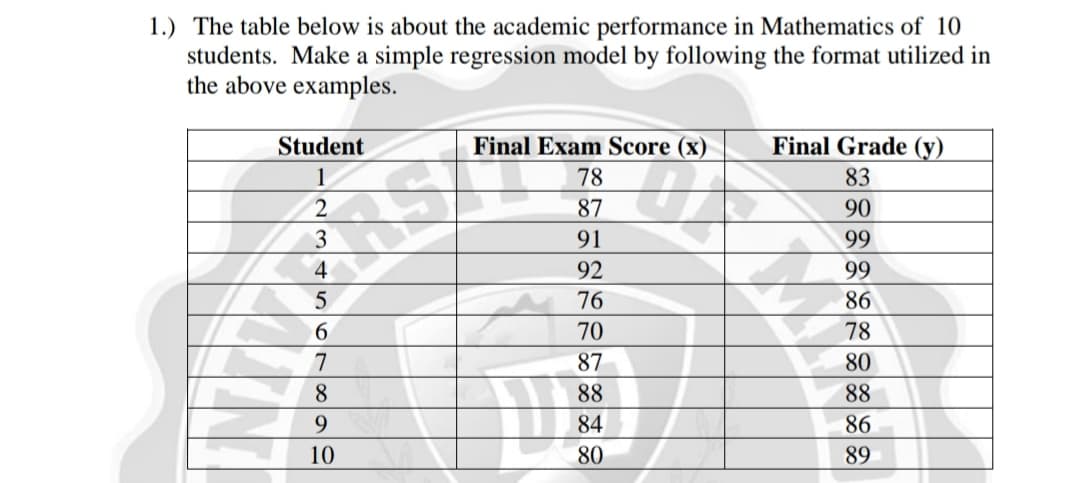
students. Make a simple regression model by following the format utilized in the above examples. Student Final Exam Score (x) Final Grade (y) 78 83 87 90 91 99 92 99 76 86 6. 70 78 7 87 80 8. 88 88 9. 84 86 10 80 89


Q: Listed below are the heights (cm) of winning presidential candidates and their main opponents from…
A: Solution-: Let, X=President height and Y= Opponent height We have following table: X Y 192 180…
Q: Find the value of s in a simple linear regression model if SSE = 175 and n = 27. O 7 24 148 6.4
A: The variance is calculated ass2=SSEn-1
Q: Find the regression equation, letting the first variable be the predictor (x) variable. Using the…
A: find the regression equation y hat = ? + ? x The best predicted age of the best actor winner given…
Q: y 96 99 81 47 71 78 72 34 50 66 94 85 77 82 99 99 67 68 The grades of a sample of 9 students on a…
A: Find Regression line equations from the following data, X Y 96 99 81 47 71 78 72 34 50…
Q: Find the regression equation, letting the first variable be the predictor (x) variable. Using the…
A: Given n=12 X=32
Q: 1. The table below shows the number of people, p, and suitcases, s, on 8 airplanes 63 115 153 192…
A:
Q: 1. The table below lists U.S. fossil fuel consumption as a percentage of a total fuel consumption…
A:
Q: Bob's Burgers is a chain of hamburger fast food restaurants located all over the state of Alaska.…
A: Coefficient of determination: The coefficient of determination tells about the percentage of…
Q: Use a graphing calculator to find a linear regression model for the men's 100-meter freestyle data…
A: Solution: from the data finding linear regression model for both men and women we are using a…
Q: If there is a positive correlation between X and Y in a research study, then the regression equation…
A: In question, Given that there is a positive correlation between X and Y in a research study, then…
Q: Find the regression equation, letting the first variable be the predictor (x) variable. Using the…
A:
Q: A box office analyst seeks to predict opening weekend box office gross for movies. Toward this…
A: Given that, n=66 Th fitted linear regression equation Y^=0.657+1.3665Xi a) Coefficient of…
Q: A well-known university is interested in how salary (in thousands of dollars) is predicted from…
A:
Q: Find the regression equation, letting the first variable be the predictor (x) variable. Using the…
A: The independent variable is Best Actress. The dependent variable is Best Actor. The given data…
Q: (а) y 90 54 50 53 80 91 35 41 60 48 35 61 60 71 40 56 60 71 55 68 40 47 65 36 55 53 35 11 50 68 60…
A: Note: Hi, thank you for the question. As per our company guideline we are supposed to answer only…
Q: Construct the equation of the regression line. The following table lists the age of a cow (in years)…
A: The regression equation is, y⏞ = b*X +a Where, b =Σ(x-x)*(y-y)Σ(x-x)2a= y¯-b*x
Q: Find the regression equation, letting the first variable be the predictor (x) variable. Using the…
A: Given data and calculation is shown below Best Actress (x) Best Actor (y) x2 y2 xy 27 43 729…
Q: Find the regression equation, letting the first variable be the predictor (x) variable. Using the…
A: Calculate the following values: x y (xi - mean_x)2 (yi - mean_y)2 (xi - mean_x)*(yi - mean_y)…
Q: The slope B of a simple linear regression model determines the coefficient of determination R. O…
A:
Q: The table below shows the number of state-registered automatic weapons and the murder rate for…
A: The concept of regression was introduced by Sir Francis Galton. Regression is estimating the unknown…
Q: The grades of a class of 9 students on a midterm report (x) and on the final examination (y) are as…
A: (a). Let X denote the Mid term report Let Y denote the final examination Calculation :…
Q: The Kak Ramah company supplies vegetables to shop as wholesales. The demand for the vegetables…
A: Regression Equation = ŷ = bX + a
Q: Find the regression equation, letting the first variable be the predictor (x) variable. Using the…
A: Use EXCEL to determine the regression equation. EXCEL procedure: Go to EXCEL Go to Data>Data…
Q: Use a graphing calculator to find a linear regression model for the men's 100- meter freestyle data…
A:
Q: Find the regression equation, letting the first variable be the predictor (x) variable. Using the…
A: Given Data : X = Age of Best Actress winner Y = Age of best actor winner 27 41 32 38 30 39…
Q: A/ Find the estimated regression line equation for the following data that represents income in…
A: Let X=Income Y=Food expenditure We want to find regression line
Q: Find the regression equation, letting the first variable be the predictor (x) variable. Using the…
A: Regression: In order to obtain the equation of the regression line, first perform regression…
Q: Name Abhu Keit Carli Danni Ek Liang Ramone Age 1 3 6 9 10 11 12 Show size 1 4 7 6 9 9 1 Consider…
A:
Q: 1.) The table below is about the academic performance in Mathematics of 10 students. Make a simple…
A: The regression analysis is conducted here by using EXCEL. The software procedure is given below:…
Q: Listed below are the heights (cm) of winning presidential candidates and their main opponents from…
A: The regression equation is giving by y' = a + bx
Q: y 96 99 81 47 71 78 72 34 50 66 94 85 77 82 99 99 67 68
A:
Q: The regression equation is Price = ß + ØBedroom + yHouse Size + ALot Size Predictor SE Coef Coef T P…
A: According aur policy we can answer only first three subpart for remaining please repost the…
Q: When building a multiple regression model, Im(Tip-Bill*Smoker, data=TIPS), the summary output is the…
A: Given a regression model Im(Tip-Bill Smoker, data=TIPS), the summary output is the following general…
Q: 7. Which of the following equations may be analyzed using the linear regression method and explain…
A: The answer is in the next step
Q: A/ Find the estimated regression line equation for the following data that represents income in…
A: Given : Income 35 49 21 39 15 28 25 Food expenditure 9 15 7 11 5 8 9 Here ; Income :…
Q: 96 99 81 47 71 78 72 34 50 66 94 85 77 82 99 99 67 68 The grades of a sample of 9 students on a…
A: Calculate Fitting a straight line(Regression line) - Curve fitting using Least square method X Y…
Q: The following table The following table The use of a specific type of fertilizer b (unit) per acre…
A: Regression Equation: When we want to predict the value of one variable, say Y, from the given value…
Q: 3. The table shows the average price of a personal computer during certain years. year 1997 1999…
A:
Q: Find the regression equation, letting the first variable be the predictor (x) variable. Using the…
A:
Q: Find the regression equation, letting the first variable be the predictor (x) variable. Using the…
A: Given data, Best Actress Best Actor 27 45 30 37 28 37 61 46 30…
Q: 11.2/398 The grades of a class of 9 students on a midterm report (x) and on the final examination…
A:
Q: Given: Student Pre-test Scores Post-test Scores 1 84 85 2 78 86 ITT 3 88 89 4 79 83 5 84 87 Find:…
A:
Q: students. Make a multiple regression model. Interpret the result. Performance Task Score (x2)…
A: Use the Excel And Perform the Regression. Followings are the Steps to perform the Regression 1) Open…
Q: raph the scatterplot and find the equation of the regression line GDP. CO2 emissions (in…
A:
Q: Find the regression equation, letting the first variable be the predictor (x) variable. Using the…
A: Hey, since there is multiple sub part questions posted, we will answer first three subpart…
Q: The value of a sports franchise is directly related to the amount of revenue that a franchise can…
A: First let us enter the data into Excel as follows.
Q: A well-known university is interested in how salary (in thousands of dollars) is predicted from…
A: Given regression equations are : Faculty (n = 170): ŷ = 60 + 1.1x Admin. (n = 155): ŷ = 57 + 1.5x
Q: Suppose that the table shows the COVID-19 cases and deaths in some NCR cities during the COVID-19…
A: Given data is
Q: Use a graphing calculator to find a linear regression model for the men's 100-meter freestyle data…
A: The independent variable is Women. The dependent variable is Men. We have to write the linear…
Q: 1) The accompanying table shows the enrollment of a preschool from 1980 through 2000. Write a linear…
A:

Step by step
Solved in 2 steps with 2 images

- Olympic Pole Vault The graph in Figure 7 indicates that in recent years the winning Olympic men’s pole vault height has fallen below the value predicted by the regression line in Example 2. This might have occurred because when the pole vault was a new event there was much room for improvement in vaulters’ performances, whereas now even the best training can produce only incremental advances. Let’s see whether concentrating on more recent results gives a better predictor of future records. (a) Use the data in Table 2 (page 176) to complete the table of winning pole vault heights shown in the margin. (Note that we are using x=0 to correspond to the year 1972, where this restricted data set begins.) (b) Find the regression line for the data in part ‚(a). (c) Plot the data and the regression line on the same axes. Does the regression line seem to provide a good model for the data? (d) What does the regression line predict as the winning pole vault height for the 2012 Olympics? Compare this predicted value to the actual 2012 winning height of 5.97 m, as described on page 177. Has this new regression line provided a better prediction than the line in Example 2?The following fictitious table shows kryptonite price, in dollar per gram, t years after 2006. t= Years since 2006 0 1 2 3 4 5 6 7 8 9 10 K= Price 56 51 50 55 58 52 45 43 44 48 51 Make a quartic model of these data. Round the regression parameters to two decimal places.The following table shows the annual number of PhD graduates in a country in various fields. NaturalSciences Engineering SocialSciences Education 1990 70 10 70 30 1995 130 40 110 50 2000 330 130 280 140 2005 490 370 460 210 2010 590 550 830 520 2012 690 590 1,000 900 (a) With x = the number of social science doctorates and y = the number of education doctorates, use technology to obtain the regression equation. (Round coefficients to three significant digits.) y(x) = Graph the associated points and regression line. (b) What does the slope tell you about the relationship between the number of social science doctorates and the number of education doctorates? The slope tells us the increase in the number of social science doctorates for each additional education doctorate.The slope tells us the increase in the number of education doctorates for each additional social science doctorate. The slope tells us the decrease in the number…
- The following table shows the annual number of PhD graduates in a country in various fields. NaturalSciences Engineering SocialSciences Education 1990 70 10 60 30 1995 130 40 120 50 2000 330 130 280 140 2005 490 370 460 210 2010 590 550 830 520 2012 690 590 1,000 900 (a) With x = the number of social science doctorates and y = the number of education doctorates, use technology to obtain the regression equation. (Round coefficients to three significant digits.) y(x) = Graph the associated points and regression line. (b) What does the slope tell you about the relationship between the number of social science doctorates and the number of education doctorates? The slope tells us the increase in the number of education doctorates for each additional social science doctorate.The slope tells us the decrease in the number of education doctorates for each additional social science doctorate. The slope tells us the increase in the number…The following table shows the annual number of PhD graduates in a country in various fields. NaturalSciences Engineering SocialSciences Education 1990 70 10 60 30 1995 130 40 100 50 2000 330 130 280 140 2005 490 370 460 210 2010 590 550 830 520 2012 690 590 1,000 900 (a) With x = the number of social science doctorates and y = the number of education doctorates, use technology to obtain the regression equation. (Round coefficients to three significant digits.) y(x) =The table below shows the number of state-registered automatic weapons and the murder rate for several Northwestern states, where xx is thousands of automatic weapons and yy is murders per 100,000 residents. xx 11.3 8.2 7.1 3.7 2.9 2.2 2.1 0.6 yy 13.9 10.7 10.3 7.2 6.5 5.6 5.5 4.6 Use your calculator to determine the equation of the regression line and write it in the y=ax+by=ax+b form. Round to 2 decimal places. According to this model, how many murders per 100,000 residents can be expected in a state with 4.6 thousand automatic weapons? Round to 3 decimal places. According to this model, how many murders per 100,000 residents can be expected in a state with 4.4 thousand automatic weapons? Round to 3 decimal places.
- The following table shows the annual number of PhD graduates in a country in various fields. NaturalSciences Engineering SocialSciences Education 1990 70 10 60 30 1995 130 40 120 40 2000 330 130 280 120 2005 490 370 460 210 2010 590 550 830 520 2012 690 590 1,000 900 (a)With x = the number of social science doctorates and y = the number of education doctorates, use technology to obtain the regression equation. (Round coefficients to three significant digits.) y(x) =The following table shows the annual number of PhD graduates in a country in various fields. NaturalSciences Engineering SocialSciences Education 1990 70 10 70 30 1995 130 40 110 40 2000 330 130 280 120 2005 490 370 460 210 2010 590 550 830 520 2012 690 590 1,000 900 (a) With x = the number of social science doctorates and y = the number of education doctorates, use technology to obtain the regression equation. (Round coefficients to three significant digits.) y(x) = (b) Use technology to obtain the coefficient of correlation r. (Round your answer to three decimal places.) r =A random sample of twelve students were chosen, and their midterm test score (y), as- signment score (x1), and missed classes (x2) were recorded as follows: Midterm Score, y Assignment Score, x1 Classes Missed, x2 85 74 76 90 85 87 94 98 81 91 76 74 65 50 55 65 55 70 65 70 55 70 50 55 5 7 5 2 6 3 2 5 4 3 1 4 (i) What is the fitted multiple linear regression equation of the form yˆ = b0 + b1x1 + b2x2? (ii) From part (i) above, estimate the midterm test score grade for a student who has an assignment score of 60 and missed 4 classes.


