Suppose that for each one-percentage-point increase in the interest rate, the level of investment spending declines by $0.5 billion. The change in th interest rate (according to the change you made to the money market in the previous scenario) therefore causes the level of investment spending to ▼ by After the multiplier effect is accounted for, the change in investment spending will cause the quantity of output demanded to by at each price level. The impact of an increase in government purchases on the interest rate and the level of investment spending is effect. known as the Use the purple line (diamond symbol) on the graph at the beginning of this problem to show the aggregate demand curve (AD3) after accounting for the impact of the increase in government purchases on the interest rate and the level of investment spending. Hint: Be sure your final aggregate demand curve (AD3) is parallel to AD₁ and AD2. You can see the slopes of AD₁ and AD2 by selecting them on the graph.
Suppose that for each one-percentage-point increase in the interest rate, the level of investment spending declines by $0.5 billion. The change in th interest rate (according to the change you made to the money market in the previous scenario) therefore causes the level of investment spending to ▼ by After the multiplier effect is accounted for, the change in investment spending will cause the quantity of output demanded to by at each price level. The impact of an increase in government purchases on the interest rate and the level of investment spending is effect. known as the Use the purple line (diamond symbol) on the graph at the beginning of this problem to show the aggregate demand curve (AD3) after accounting for the impact of the increase in government purchases on the interest rate and the level of investment spending. Hint: Be sure your final aggregate demand curve (AD3) is parallel to AD₁ and AD2. You can see the slopes of AD₁ and AD2 by selecting them on the graph.

Chapter16: Monetary Policy
Section: Chapter Questions
Problem 8SQ

Related questions
Question
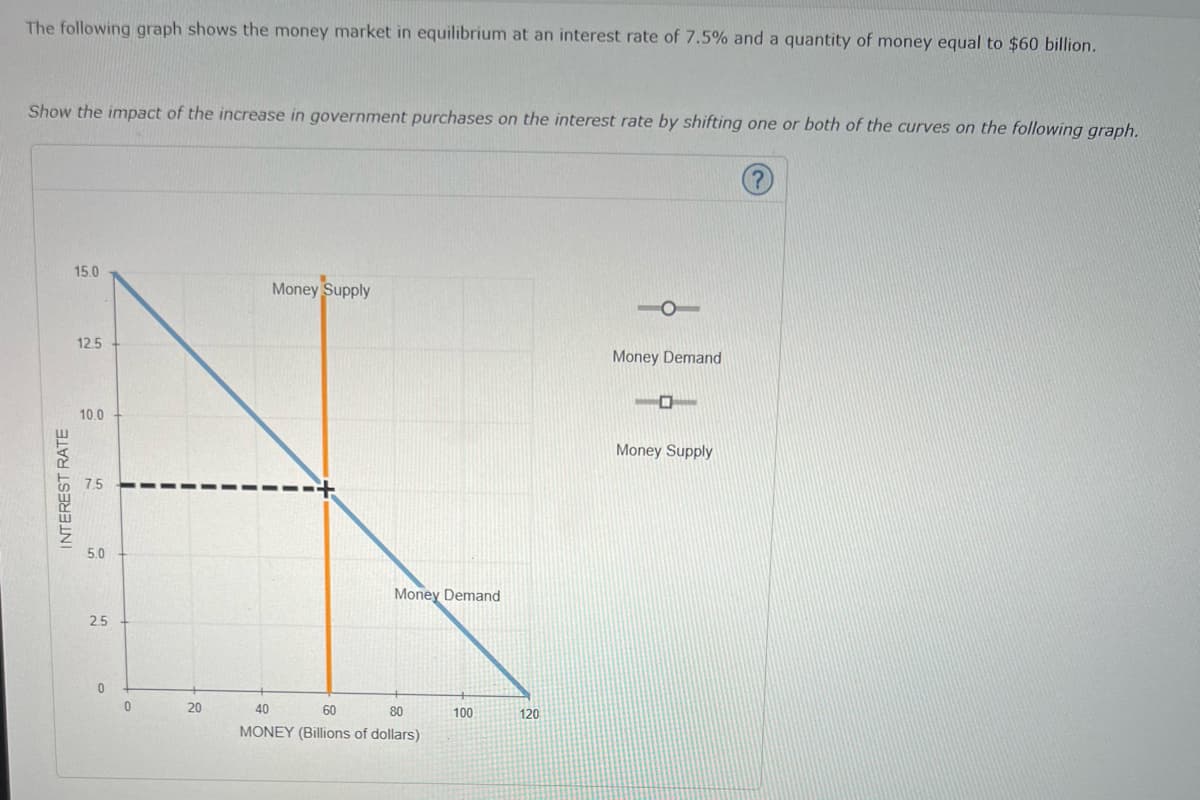
Transcribed Image Text:The following graph shows the money market in equilibrium at an interest rate of 7.5% and a quantity of money equal to $60 billion.
Show the impact of the increase in government purchases on the interest rate by shifting one or both of the curves on the following graph.
15.0
Money Supply
Money Demand
0
Money Supply
12.5
10.0
INTEREST RATE
5
5.0
25
0
0
20
Money Demand
40
60
80
100
MONEY (Billions of dollars)
120
Transcribed Image Text:5.0
2.5
0
Money Demand
IS
0
20
40
60
80
100
120
MONEY (Billions of dollars)
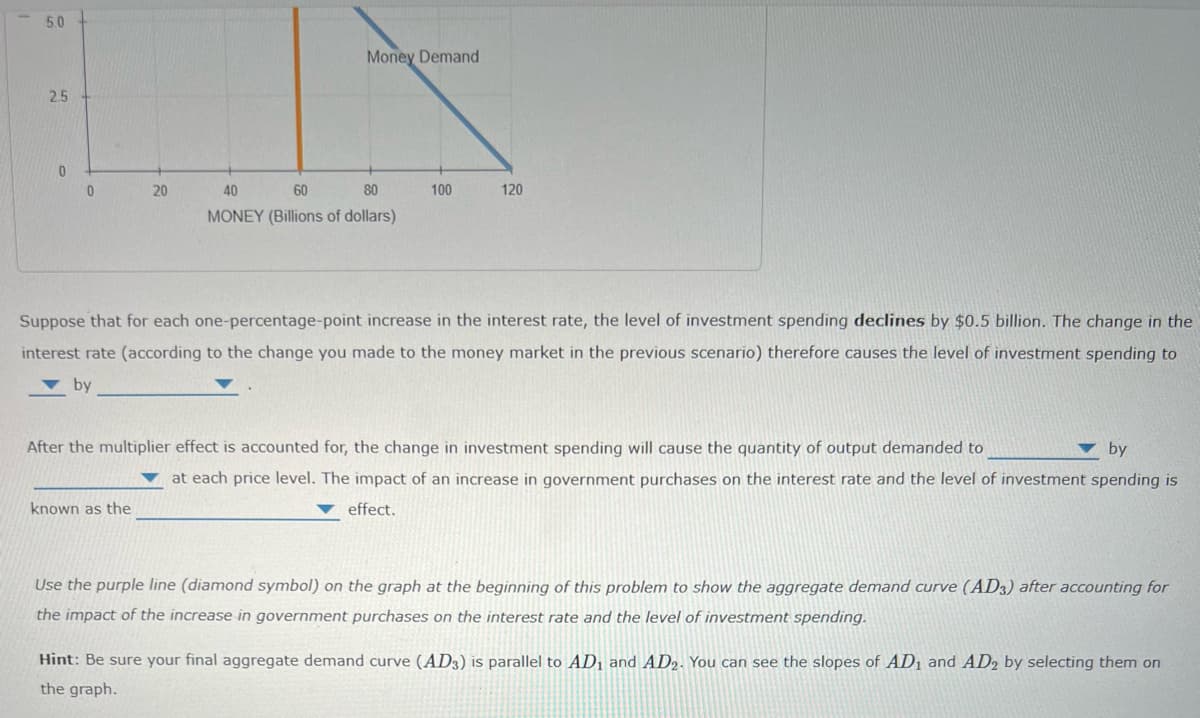
Suppose that for each one-percentage-point increase in the interest rate, the level of investment spending declines by $0.5 billion. The change in the
interest rate (according to the change you made to the money market in the previous scenario) therefore causes the level of investment spending to
by
After the multiplier effect is accounted for, the change in investment spending will cause the quantity of output demanded to
by
at each price level. The impact of an increase in government purchases on the interest rate and the level of investment spending is
known as the
effect.
Use the purple line (diamond symbol) on the graph at the beginning of this problem to show the aggregate demand curve (AD3) after accounting for
the impact of the increase in government purchases on the interest rate and the level of investment spending.
Hint: Be sure your final aggregate demand curve (AD3) is parallel to AD₁ and AD2. You can see the slopes of AD₁ and AD2 by selecting them on
the graph.
Expert Solution
This question has been solved!
Explore an expertly crafted, step-by-step solution for a thorough understanding of key concepts.

Step by step
Solved in 4 steps with 2 images

Knowledge Booster


Learn more about
Need a deep-dive on the concept behind this application? Look no further. Learn more about this topic, economics and related others by exploring similar questions and additional content below.Recommended textbooks for you


