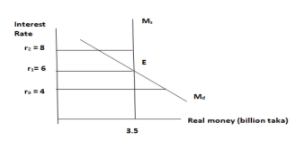
he following diagram represents the equilibrium in the money market. Explain the following question with the help of the graph ( in the picture ): a) What is the equilibrium level of interest rate and quantity of money demanded and supplied? b) What would happen in the money market if the market prevailing interest rate is 8? Describe the adjustment mechanism? c) How price level affects the money demand curve? How could you reflect this change diagrammatically? d) Why the Money supply curve is vertical and independent of the interest rate? Explain? e) Suppose central bank of Bangladesh decided to use open market sale of securities. How does it affect the money supply of the economy? Explain with graph?


The following diagram represents the equilibrium in the
a) What is the equilibrium level of interest rate and quantity of money demanded and supplied?
b) What would happen in the money market if the market prevailing interest rate is 8? Describe the adjustment mechanism?
c) How price level affects the money
d) Why the Money supply curve is vertical and independent of the interest rate? Explain?
e) Suppose central bank of Bangladesh decided to use open market sale of securities. How does it affect the money supply of the economy? Explain with graph?


Trending now
This is a popular solution!

Step by step
Solved in 4 steps with 3 images


