Suppose a doctor measures the height, x, and head circumference, y, of 11 children and obtains the data below. The correlation coefficient is 0.896 and the least squares regression line is y = 0.258x + 10.348. Complete parts (a) and (b) below. Height, x Head Circumference, y 17.2 16.9 17.2 16.9 17.5 17.4 17.1 17.3 17.3 17.3 17.3 27 25.5 26.5 25.5 27.25 26.75 26 26.75 27.25 27.25 26.75 ..... (a) Compute the coefficient of determination, R2. R2 =% (Round to one decimal place as needed.) (b) Interpret the coefficient of determination. Approximately % of the variation in (Round to one decimal place as needed.) is explained by the least-squares regression model.
Suppose a doctor measures the height, x, and head circumference, y, of 11 children and obtains the data below. The correlation coefficient is 0.896 and the least squares regression line is y = 0.258x + 10.348. Complete parts (a) and (b) below. Height, x Head Circumference, y 17.2 16.9 17.2 16.9 17.5 17.4 17.1 17.3 17.3 17.3 17.3 27 25.5 26.5 25.5 27.25 26.75 26 26.75 27.25 27.25 26.75 ..... (a) Compute the coefficient of determination, R2. R2 =% (Round to one decimal place as needed.) (b) Interpret the coefficient of determination. Approximately % of the variation in (Round to one decimal place as needed.) is explained by the least-squares regression model.

Glencoe Algebra 1, Student Edition, 9780079039897, 0079039898, 2018
18th Edition
ISBN:9780079039897
Author:Carter
Publisher:Carter
Chapter4: Equations Of Linear Functions
Section4.5: Correlation And Causation
Problem 11PPS

Related questions
Question
The options for part b are: head circumference or height
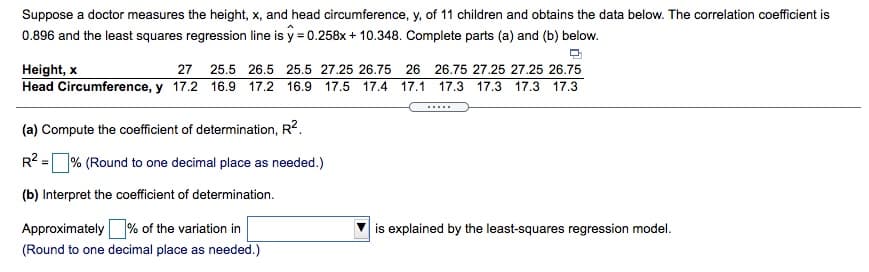
Transcribed Image Text:Suppose a doctor measures the height, x, and head circumference, y, of 11 children and obtains the data below. The correlation coefficient is
0.896 and the least squares regression line is y = 0.258x+ 10.348. Complete parts (a) and (b) below.
Height, x
Head Circumference, y 17.2 16.9 17.2 16.9 17.5
27
25.5 26.5 25.5 27.25 26.75 26 26.75 27.25 27.25 26.75
17.4
17.1
17.3 17.3
17.3 17.3
(a) Compute the coefficient of determination, R2.
R? =% (Round to one decimal place as needed.)
(b) Interpret the coefficient of determination.
Approximately% of the variation in
(Round to one decimal place as needed.)
is explained by the least-squares regression model.
Expert Solution
This question has been solved!
Explore an expertly crafted, step-by-step solution for a thorough understanding of key concepts.

This is a popular solution!

Trending now
This is a popular solution!

Step by step
Solved in 2 steps

Recommended textbooks for you
Glencoe Algebra 1, Student Edition, 9780079039897…
Algebra
ISBN:
9780079039897
Author:
Carter
Publisher:
McGraw Hill

Linear Algebra: A Modern Introduction
Algebra
ISBN:
9781285463247
Author:
David Poole
Publisher:
Cengage Learning

Big Ideas Math A Bridge To Success Algebra 1: Stu…
Algebra
ISBN:
9781680331141
Author:
HOUGHTON MIFFLIN HARCOURT
Publisher:
Houghton Mifflin Harcourt
Glencoe Algebra 1, Student Edition, 9780079039897…
Algebra
ISBN:
9780079039897
Author:
Carter
Publisher:
McGraw Hill
Linear Algebra: A Modern Introduction
Algebra
ISBN:
9781285463247
Author:
David Poole
Publisher:
Cengage Learning
Big Ideas Math A Bridge To Success Algebra 1: Stu…
Algebra
ISBN:
9781680331141
Author:
HOUGHTON MIFFLIN HARCOURT
Publisher:
Houghton Mifflin Harcourt