1. An experiment was run and the following data table was produced: Input Response 2.5 3 4 4.5 (a) Calculate the correlation coefficient for the data. Is the data positively or negatively correlated, and is that correlation weak, moderate, or strong? (b) Find the equation of the least squares regression line and plot the line on top of a scatterplot of the data.
Q: Given the following data set, let xx be the explanatory variable and yy be the response variable.…
A: (a)
Q: An article included a summary of findings regarding the use of SAT I scores, SAT II scores, and high…
A: Note: Hi there! Thank you for posting the question. As there are several independent questions,…
Q: il T-Mobile 11:42 am 48% Home Edit Yesterday 5:52 pm Canvas 因 国 Part of an Excel regression output…
A:
Q: A recent campus bookstore survey sought to determine if there is a relationship between new textbook…
A: Given, The least-squares regression line for the study is y = 38.04 + 0.12x Where x is the number of…
Q: A scatterplot of student height, in inches, versus corresponding arm span length, in inches, is…
A: Correct statement is The slope of the least squares regression line increases and the correlation…
Q: Given the following data set, let xx be the explanatory variable and yy be the response variable.…
A: Coefficient of Determination is represented as the percentage of variation in the yy would be…
Q: Suppose a doctor measures the height, x, and head circumference, y, of 8 children and obtains the…
A:
Q: Given the following data (suppose x is the explanatory variable and y is the response variable) :…
A: From the given in formation, Consider, the data set as given below: x y 2 3 4 6 6 8 8 12…
Q: Suppose a doctor measures the height, x, and head circumference, y, of 11 children and obtains the…
A: Calculation: From the table,
Q: Based on the following data - (a) units produced from September to December are as follows: 18,900,…
A: The least squares regression equation is the best method for forecasting (or) prediction .The…
Q: The following activity and cost data that were provided by Hoist Corporation would help in…
A: Regression line are used to predict the observations. It explains the relationship between the…
Q: What is the interc Given the following data (suppose x is the explanatory variable and y is the…
A: Given that : suppose x is the explanatory variable and y is the response variable x y 2 3 4 6…
Q: Suppose a doctor measures the height, x, and head circumference, y, of 11 children and obtains the…
A:
Q: Given the following data (suppose x is the explanatory variable and y is the response variable) :…
A:
Q: The following gives the number of accidents that occurred on Florida State Highway 101 during the…
A: Sum of X = 10Sum of Y = 229Mean X = 2.5Mean Y = 57.25Sum of squares (SSX) = 5Sum of products (SP) =…
Q: Given the following data (suppose x is the explanatory variable and y is the response variable) :…
A: Introduction - Regression - regression is the process of building a model of the relationship…
Q: The marks obtained by 10 students in statistics (x) and algebra (y) are as follows: Table 6 88 82 73…
A: Correlation Coefficient: Let (x1, y1), (x2, y2), ... , (xn, yn) be n set of observations for the…
Q: From the below table, Use excels to find the answer for the below questions: State Percentage…
A: Solution: Let X be the percentage proficient in reading and Y be the percentage proficient in…
Q: Suppose a doctor measures the height, x, and head circumference, y, of 11 children and obtains the…
A: From the provided information, The correlation coefficient (R) = 0.914 a) The required coefficient…
Q: SSR in linear regression is equal to? SST-SSE SST+SSE SSE-SST SST x SSE…
A: From the provided information, SSR is the sum of squared deviations which is obtained by difference…
Q: (a) The correlation coefficient is r = (b) The equation of the least squares line is ŷ =
A: Given: Team Games won, x Batting average, y 1 61 278 2 66 273 3 116 278 4 120 264 5 87…
Q: 1. A publisher of books has produced five comparable Statistical Management books with the following…
A: Consider the following calculations:
Q: Like father, like son: In 1906 , the statistician Karl Pearson measured the heights of 1078…
A:
Q: 14.4 THE STARTING SALARY CASE StartSal The chairman of the marketing department at a large state…
A: Given, The chairman of the marketing department at a large state university undertakes a stdy to…
Q: Based on the following output tables, write all the panel data regression models. Which is a better…
A: Identify the regression models: Multiple linear regression model: A multiple linear regression model…
Q: Y 5 4 5 10 12 15 Assume that x is the explanatory variable and y is the response variable. What is…
A: The strength of the relationship between 2 variables can be calculated using the correlation…
Q: Researchers measured the percent body fat and the preferred amount of salt (percent weight/volume)…
A: Data given x y 0.2 20 0.3 30 0.4 22 0.5 30 0.6 38 0.8 23 1.1 30
Q: 2. Given the following data: X number of inventors in company Y number of patents 12.0 15.0 17.0…
A: Hi, we are supposed to answer three subparts at a time. Since you have not mentioned which subpart…
Q: Consider the following table of data. 1 1 2 9 y 1 2 1 2 (a) Calculate the least squares line and the…
A: a)
Q: Consider the data. xi 2 6 9 13 20 yi 9 18 9 25 23 The estimated regression equation for these data…
A: Given data: x 2 6 9 13 20 y 9 18 9 25 23 The estimated regression equation is ŷ =…
Q: The following problems can be threats to the validity of a regression discontinuity analysis, with…
A: Some of the conditions of regression discontinuity analysis are: Linear relationship Proper and…
Q: 3. Show manual computation. Refer to the table below. x2 y2 Statistics (x) Calculus (y) xy 30 28 22…
A: Since you have posted a question with multiple sub-parts, we will solve first three sub- parts for…
Q: 1) The table below shows the assay results for four samples from a gold-silver deposit. Determine…
A: The least square regression line equation is given by y = a + bx Where a and b are the intercept and…
Q: Now, the predictors flyer and display were added to the dataset and a multiple linear regression…
A: Given:
Q: Consider the following table of data. 1 2 4 9. y 1 2 4 -20 (a) Calculate the least squares line and…
A: Given values for x and y. We need to find the least square line.
Q: n experiment was run and the following data table was produced: (a) Calculate the correlation…
A: (a) The conditions for correlation: If r= ̶ 1, then the correlation between the two variables…
Q: Suppose a doctor measures the height, x, and head circumference, y, of 11 children and obtains the…
A: Solution: Given information: The least square regression line is y^=0.185x+12.276 The correlation…
Q: In a 45-story Skyscraper, residents of different floors have different levels of elevator usage:…
A: Note: Hey, since there are multiple subparts posted, we will answer first three subparts. If you…
Q: Given the estimated least squares regression line y = -2.48+1.63x, and a coefficient of…
A:
Q: 1. A publisher of books has produced five comparable Statistical Management books with the following…
A:
Q: Suppose a doctor measures the height, x, and head circumference, y. of 11 children and obtains the…
A: It is given that the correlation coefficient, R is 0.899 and the least squares regression line is…
Q: Given the following data (suppose x is the explanatory variable and y is the response variable) :…
A:
Q: The data is given as follow. xi 2 6 9 13 20 yi 7 18 9 26 23 The estimated regression equation…
A:
Q: onsider the data. xi 2 6 9 13 20 yi 6 16 9 24 22 a. The estimated regression equation for these data…
A: Solution: The estimated regression equation is y^=6.4+0.9x
Q: Intrigued by a 2013 sdy at the University of Nebraska that suggested marijuana smokers may be…
A: Here r2 = 0.134
Q: 2. Given the bivariate data: 1 3 6. y 3 1 a. Draw a scatter diagram for the data. Solution: b. Find…
A:
please show all steps and please write out complete SENTENCES as to how you did each step.
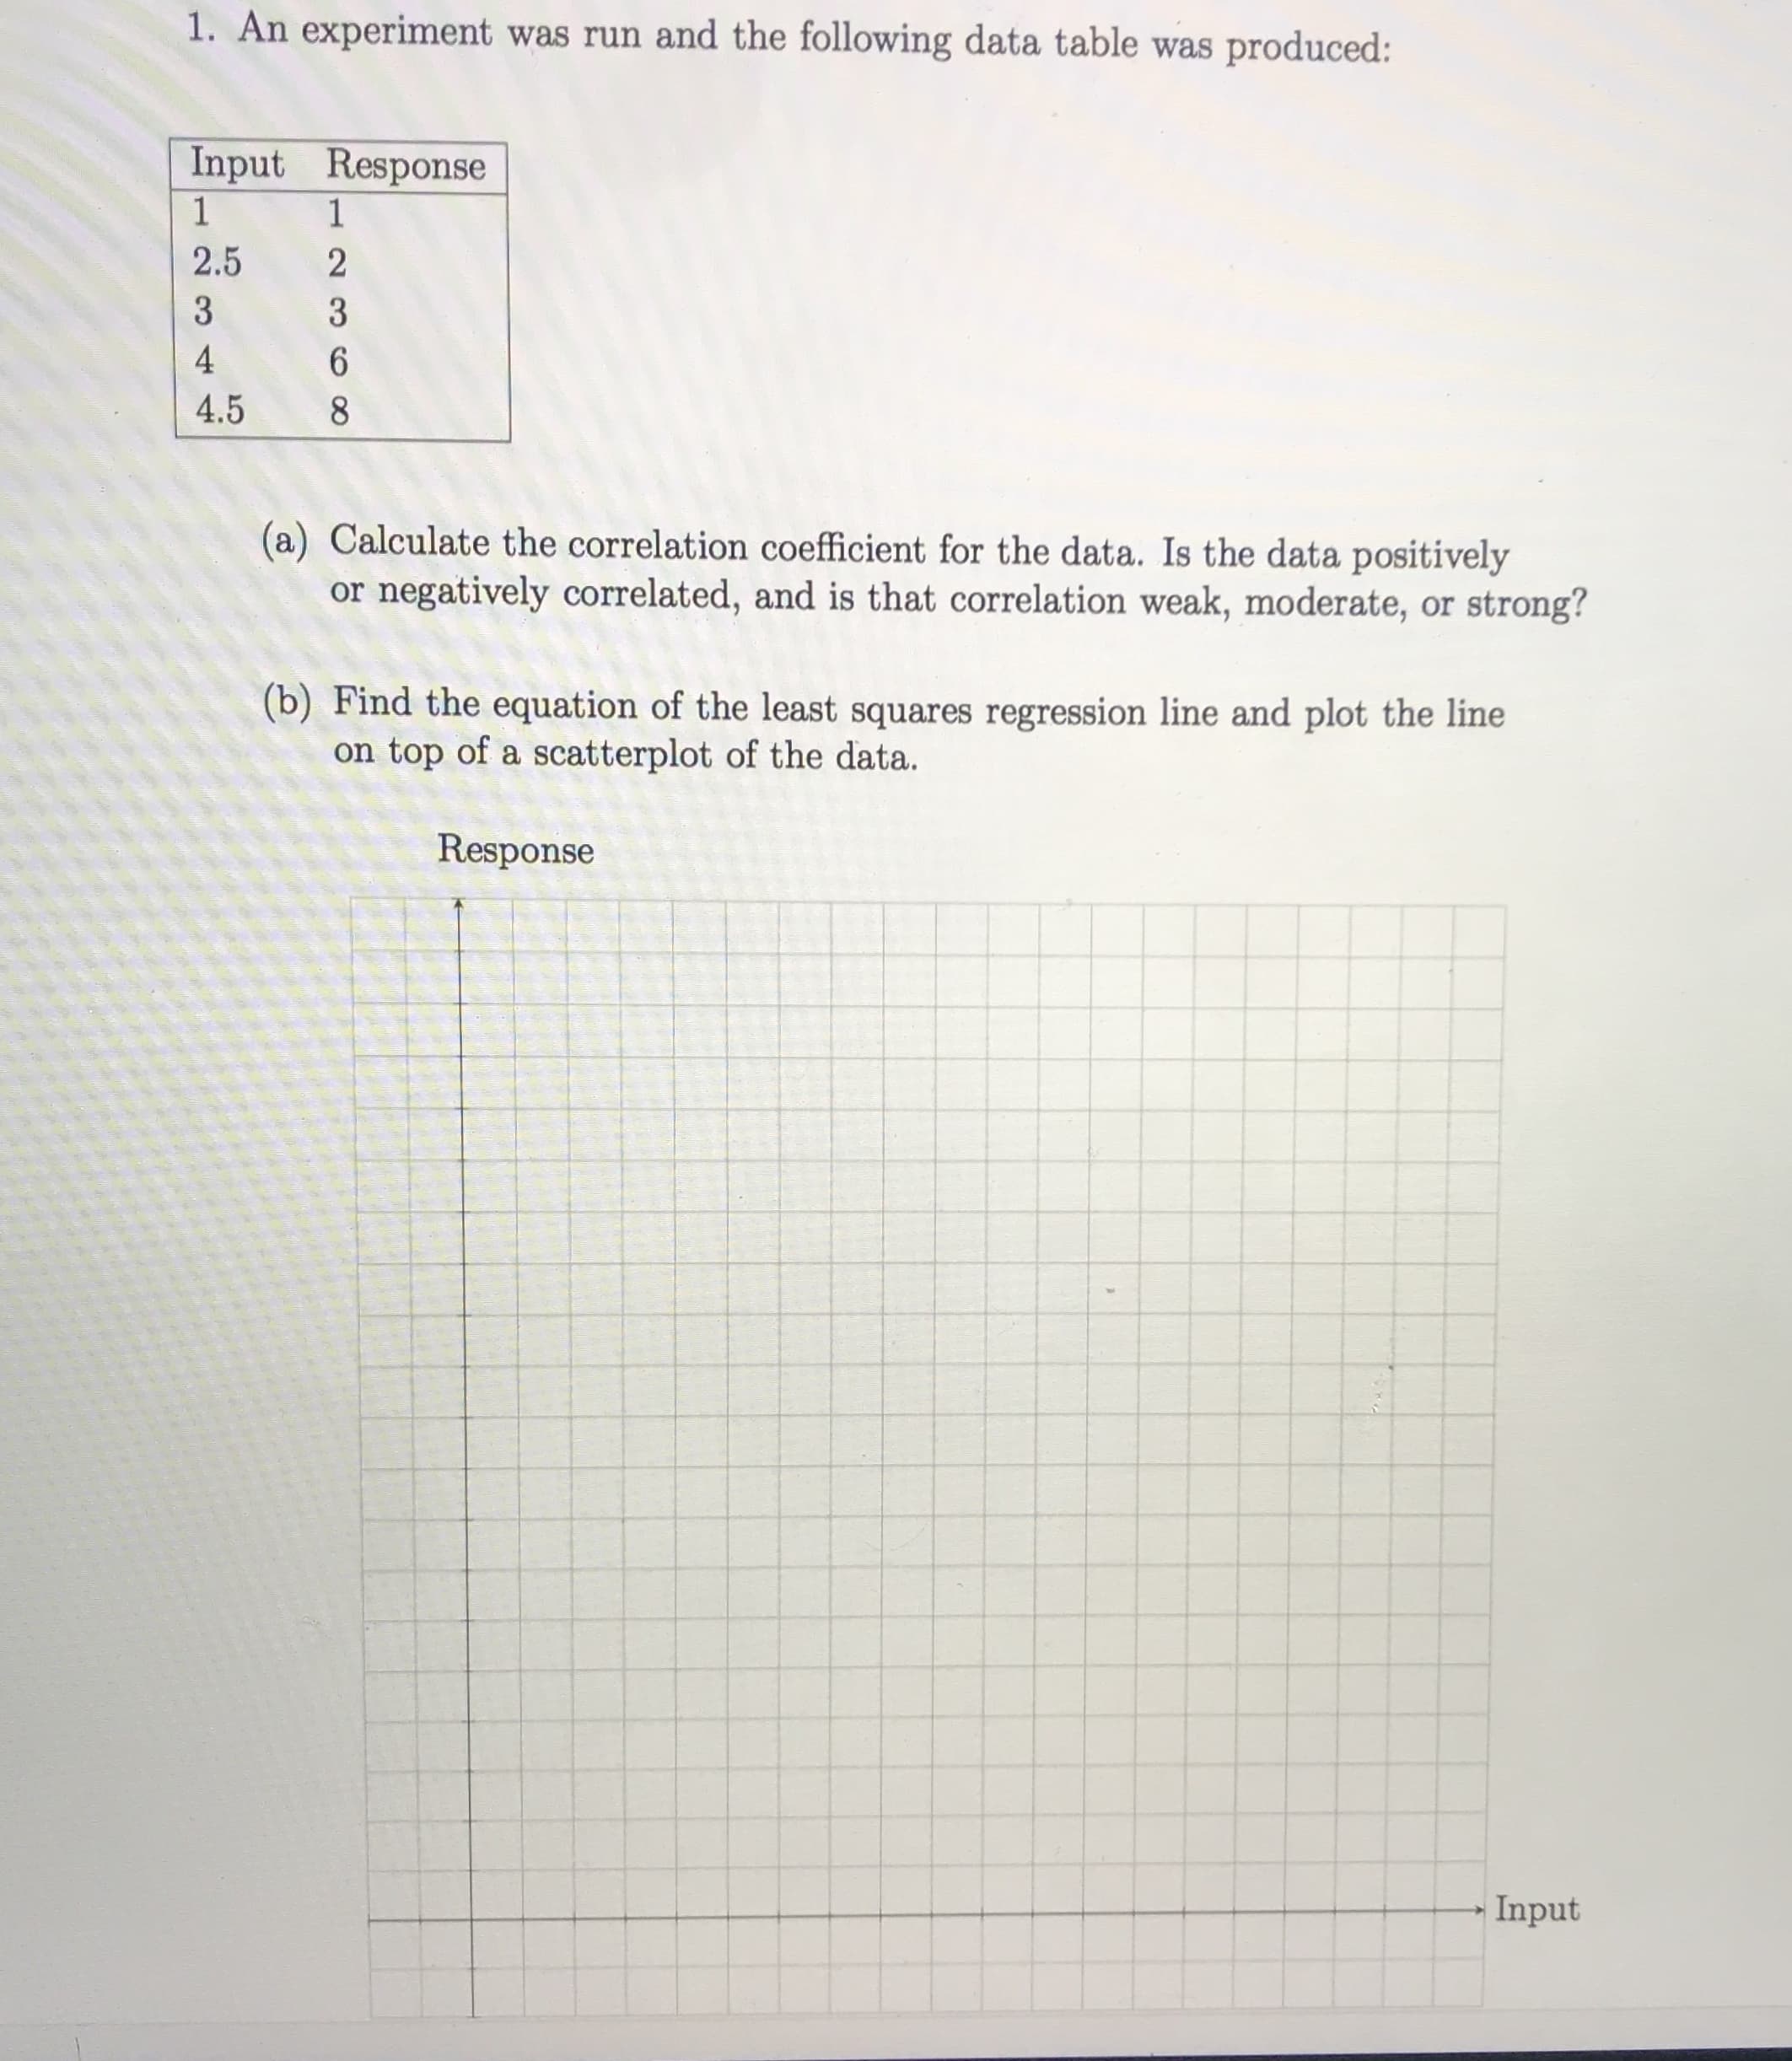
Trending now
This is a popular solution!
Step by step
Solved in 2 steps with 2 images
- Suppose a doctor measures the height, x, and head circumference, y, of 11 children and obtains the data below. The correlation coefficient is 0.904 and the least squares regression line is y=0.208x+11.736. Complete parts (a) and (b) below.Suppose a doctor measures the height, x, and head circumference, y, of 11 children and obtains the data below. The correlation coefficient is 0.899 and the least squares regression line is y=0.185x+12.276. Complete parts (a) and (b) below. Height, x 27.75 25.75 26.75 25.75 28 26.5 25.75 26.75 27 27.25 27.25 Head Circumference, y 17.4 17.1 17.2 16.9 17.4 17.1 17.1 17.3 17.3 17.3 17.4 (a) Compute the coefficient of determination, R2. R2=nothing% (Round to one decimal place as needed.) (b) Interpret the coefficient of determination. Approximately nothing% of the variation in ▼ height head circumference is explained by the least-squares regression model. (Round to one decimal place as needed.)From the below table, Use excels to find the answer for the below questions: State Percentage Proficient in Reading Percentage Proficient in Mathematics California 60 59 Texas 73 78 New York 75 70 Florida 66 68 Illinois 75 70 Pennsylvania 79 77 Ohio 79 76 Michigan 73 66 Georgia 67 64 North Carolina 71 73 Activities: Compute the least-squares regression line for predicting math proficiency from reading proficiency. Interpretation of the least-squares regression line in part a.
- A scatterplot of student height, in inches, versus corresponding arm span length, in inches, is shown below. One of the points in the graph is labeled A. If the point labeled A is removed, which of the following statements would be true? The slope of the least squares regression line is unchanged and the correlation coefficient increases. The slope of the least squares regression line is unchanged and the correlation coefficient decreases. The slope of the least squares regression line increases and the correlation coefficient increases. The slope of the least squares regression line increases and the correlation coefficient decreases. The slope of the least squares regression line decreases and the correlation coefficient increases.A regional distributor of NIKE shoes is in the process of analyzing the factors that influence thedemand for the NIKE brand. The distributor hired an economist to conduct a study on the demand for this product. The economist collected quarterly time series data from 1986Q1 to 1991Q4 on the following variables:SALES Sales of NIKE shoesRPDI Real personal disposal incomeCONF Consumer confidence indexD2 Dummy variable for quarter 2D3 Dummy variable for quarter 3D4 Dummy variable for quarter 4Ordinary Least Squares was applied using sales as the dependent variable and real personal disposal income, consumer confidence index, dummy variable for quarter 2, dummy variable for quarter 3, and dummy variable for quarter 4 as independent variables. The table below shows the OLS output.Model 1: OLS, using observations 1986:1-1991:4 (T = 24)Dependent variable: SALESCoefficient Std. Error t-ratio p-valueconst −139.452 61.8421 −2.255 0.0368 **RPDI 1.56286 0.438492 3.564 0.0022 ***CONF 0.256247…A regional distributor of NIKE shoes is in the process of analyzing the factors that influence thedemand for the NIKE brand. The distributor hired an economist to conduct a study on the demand for this product. The economist collected quarterly time series data from 1986Q1 to 1991Q4 on the following variables:SALES Sales of NIKE shoesRPDI Real personal disposal incomeCONF Consumer confidence indexD2 Dummy variable for quarter 2D3 Dummy variable for quarter 3D4 Dummy variable for quarter 4Ordinary Least Squares was applied using sales as the dependent variable and real personal disposal income, consumer confidence index, dummy variable for quarter 2, dummy variable for quarter 3, and dummy variable for quarter 4 as independent variables. The table below shows the OLS output.Model 1: OLS, using observations 1986:1-1991:4 (T = 24)Dependent variable: SALESCoefficient Std. Error t-ratio p-valueconst −139.452 61.8421 −2.255 0.0368 **RPDI 1.56286 0.438492 3.564 0.0022 ***CONF 0.256247…
- 1. An article included a summary of findings regarding the use of SAT I scores, SAT II scores, and high school grade point average (GPA) to predict first-year college GPA. The article states that "among these, SAT II scores are the best predictor, explaining 17 percent of the variance in first-year college grades. GPA was second at 15.3 percent, and SAT I was last at 13.6 percent." If the data from this study were used to fit a least squares line with y = first-year college GPA and x = high school GPA, what would the value of r2 have been? r2 =_______ 2. A study was carried out to investigate the relationship between the hardness of molded plastic (y, in Brinell units) and the amount of time elapsed since the plastic was molded (x, in hours). Summary quantities include n = 15, SSResid = 1,237.628, and SSTo = 24,619.737. Calculate and interpret the coefficient of determination. (Round the coefficient of determination to four decimal places when written as a decimal and 2 decimal…In order to determine a realistic price for a new product that a company wants to market the company’s research department selected 10 sites thought to have essentially identical sales potential and offered the product in each at a different price. The resulting sales are recorded in the accompanying table: Price ($) Sales ($1,000s) 15.00 15 15.50 14 16.00 16 16.50 9 17.00 12 17.50 10 18.00 8 18.50 9 19.00 6 19.50 5 c). Find the equation of the sample regression line using Minitab. d). Interpret the meaning of the coefficients of the equation of the sample regression line.The following table presents the percentage of students who tested proficient in reading and the percentage who tested proficient in math for each of the ten most populous states in the United States. State Percent Proficient in Reading Percent Proficient in Mathematics California 60 59 Texas 73 78 New York 75 70 Florida 66 68 Illinois 75 70 Pennsylvania 79 77 Ohio 79 76 Michigan 73 66 Georgia 67 64 North Carolina 71 73 Compute the least-squares regression line for predicting math proficiency from reading proficiency. Predict the math proficiency for another state with reading proficiency of 63 percent.
- Computer output from a least-squares regression analysis based on a sample of size 17 is shown in the table. Term COEFCOEF SE CoefSE Coef TT Constant 7.43 0.59 12.59 xx 5.65 1.14 6.45 Assuming all conditions for inference are met, which of the following defines a 95 percent confidence interval for the slope of the least-squares regression line?consider the coefficient estimates of the following market model linear regression of general motors (gm) on the S&P500 market returns coefficient estimate std error tvalue pr(>ItI) intercept 0.005860 0.0003704 1.582 0.12412 sp500 0.0904753 0.266702 3.392 0.00196 The number of observations is 32.At the 1% significance level, what is the (1)test statistic value,(2) the critical values (3) decision regarding the null hypothesis that the beta coefficient on the market returns is equal to 1.61The director of marketing at Vanguard Corporation believes that sales of the company's Bright Side laundry detergent (S) are related to Vanguard's own advertising expenditures (A), as well as the combined advertising expenditures of its three biggest rival detergents (R).The marketing director collects 36 weekly observations on S, A, and R . Vanguard's marketing director is comfortable using parameter estimates that are statistically significant at the 10 percent level or better. Give the specific statistical tool that can be used to this problem.