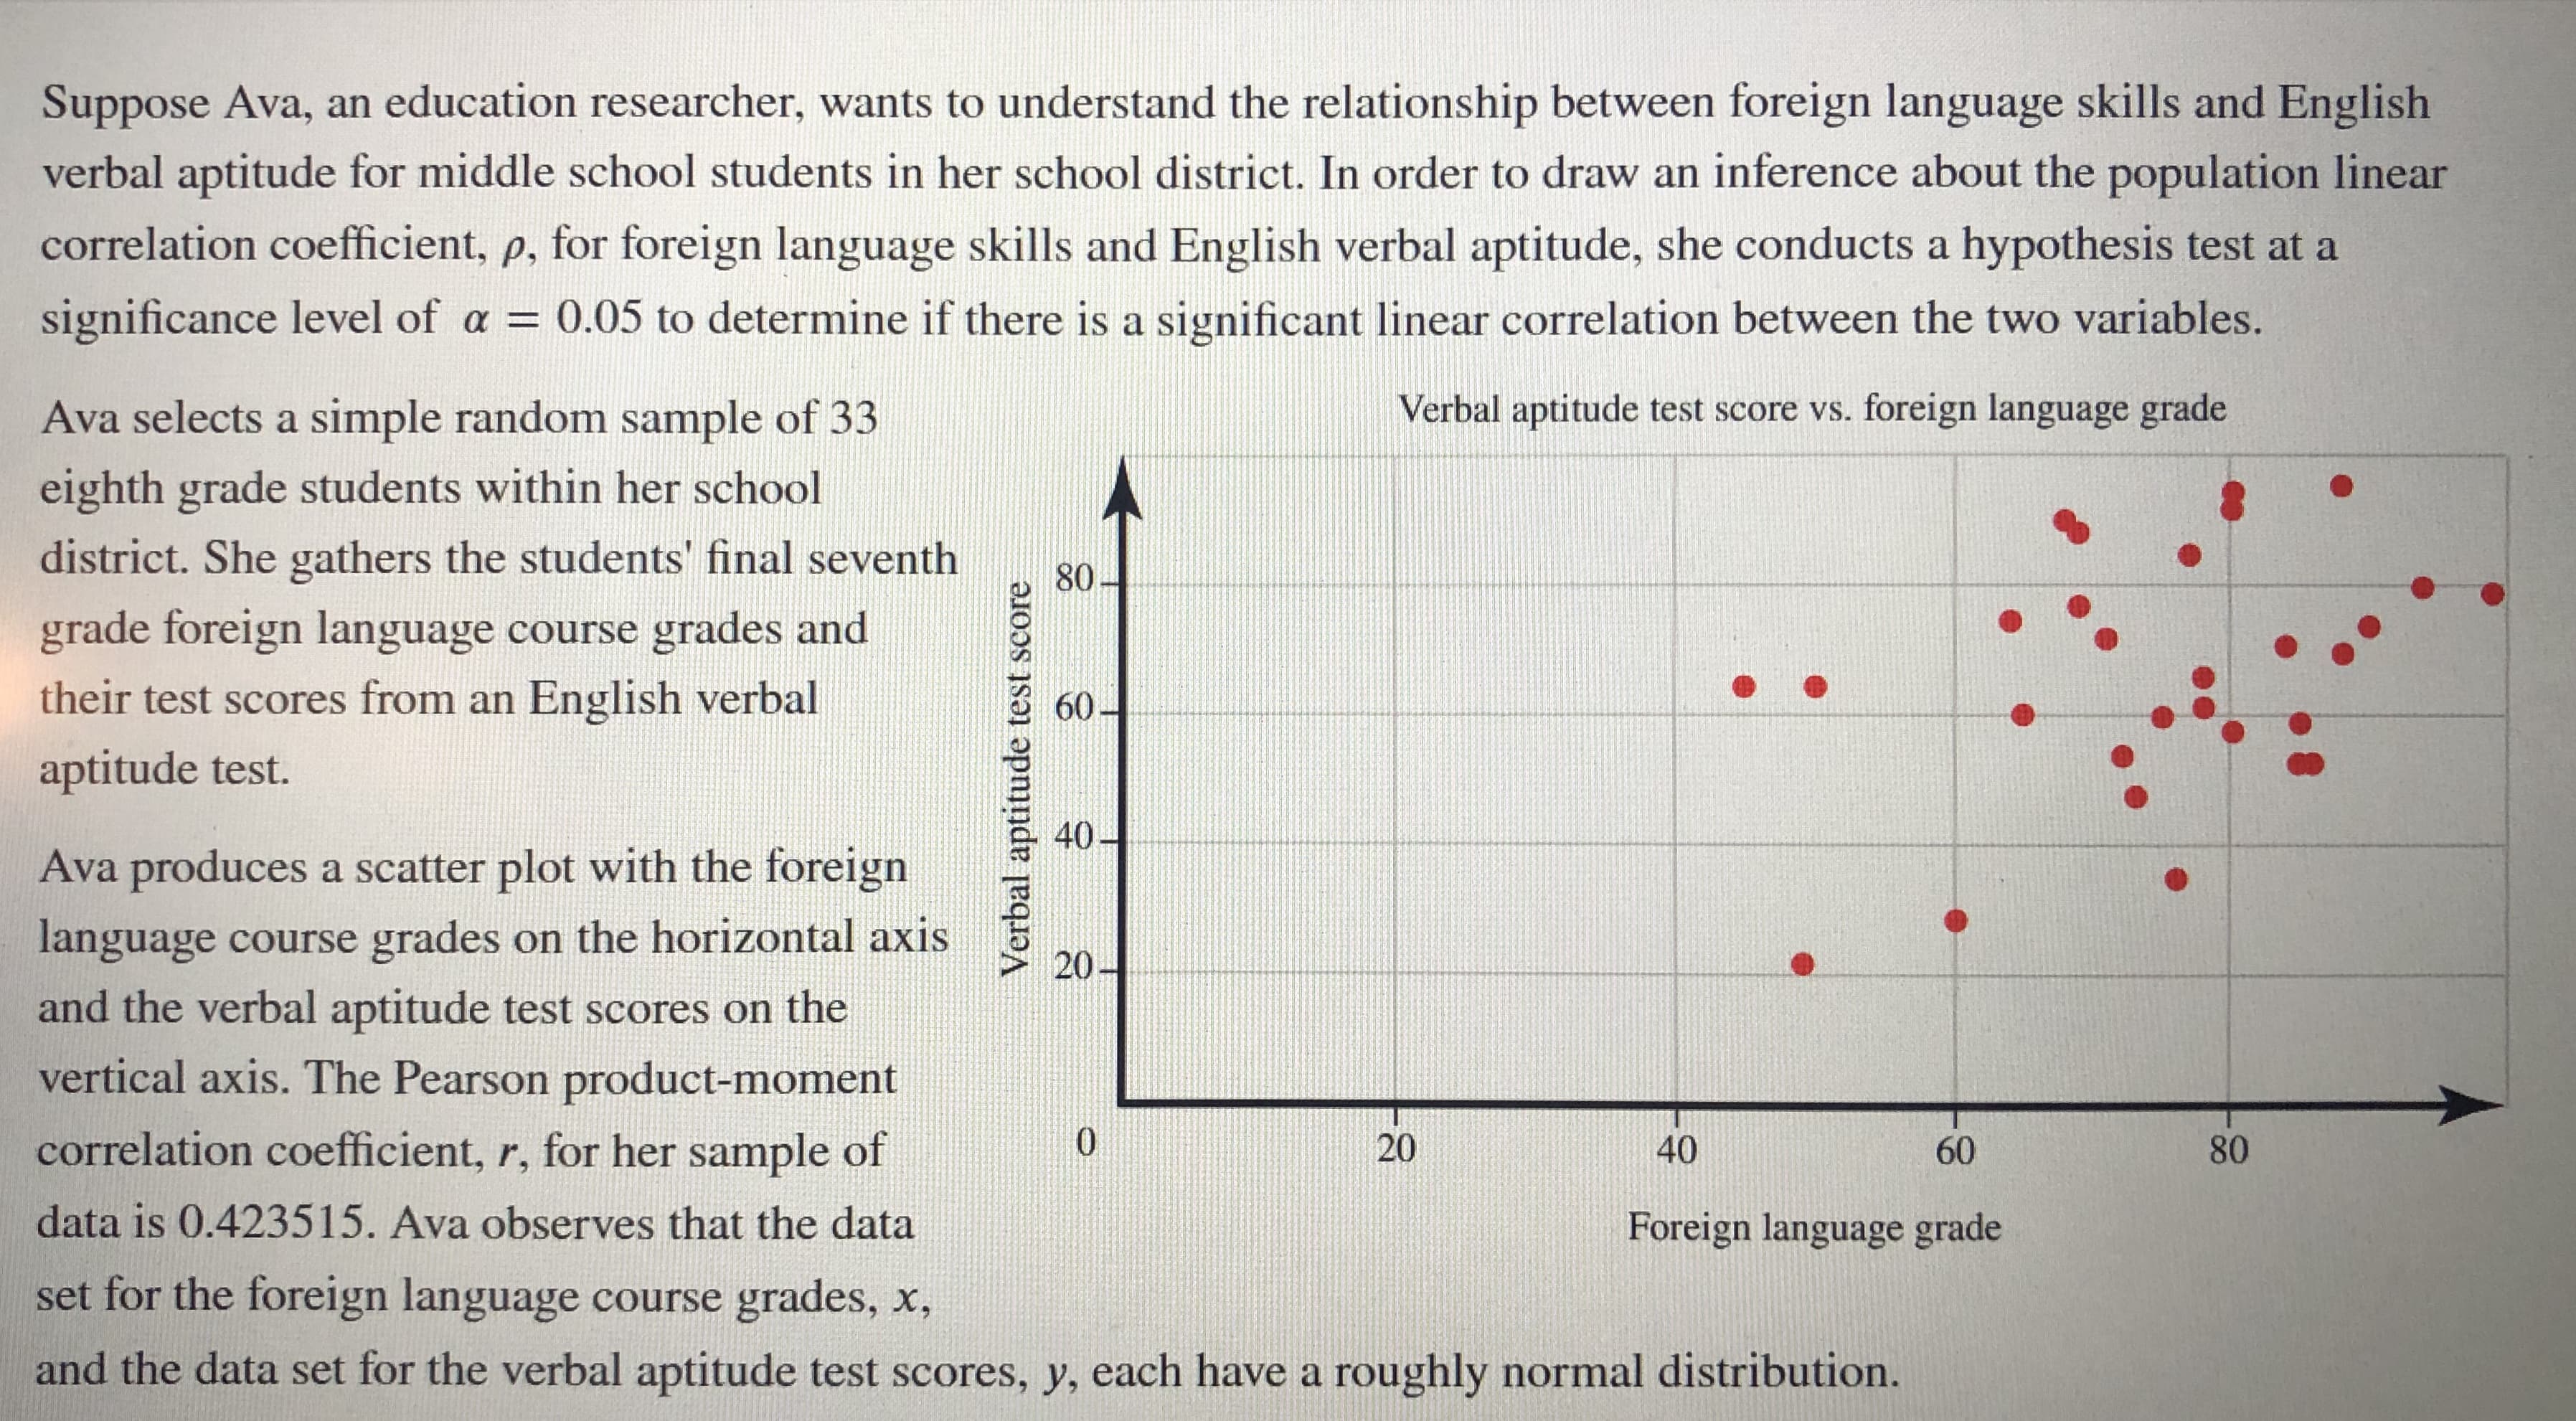
Suppose Ava, an education researcher, wants to understand the relationship between foreign language skills and English verbal aptitude for middle school students in her school district. In order to draw an inference about the population linear correlation coefficient, p, for foreign language skills and English verbal aptitude, she conducts a hypothesis test at a significance level of a = 0.05 to determine if there is a significant linear correlation between the two variables. Ava selects a simple random sample of 33 Verbal aptitude test score vs. foreign language grade eighth grade students within her school district. She gathers the students' final seventh 80 grade foreign language course grades and their test scores from an English verbal 60 aptitude test. 40- Ava produces a scatter plot with the foreign language course grades on the horizontal axis and the verbal aptitude test scores on the 20 vertical axis. The Pearson product-moment correlation coefficient, r, for her sample of 20 40 60 80 data is 0.423515. Ava observes that the data Foreign language grade set for the foreign language course grades, x, and the data set for the verbal aptitude test scores, y, each have a roughly normal distribution. Verbal aptitude test score Compute the P-value for the test statistic for Ava's hypothesis test using software. You may find this list of software manuals helpful. Provide your answer with precision to four decimal places. Avoid rounding until the final step. P-value =
Suppose Ava, an education researcher, wants to understand the relationship between foreign language skills and English verbal aptitude for middle school students in her school district. In order to draw an inference about the population linear correlation coefficient, p, for foreign language skills and English verbal aptitude, she conducts a hypothesis test at a significance level of a = 0.05 to determine if there is a significant linear correlation between the two variables. Ava selects a simple random sample of 33 Verbal aptitude test score vs. foreign language grade eighth grade students within her school district. She gathers the students' final seventh 80 grade foreign language course grades and their test scores from an English verbal 60 aptitude test. 40- Ava produces a scatter plot with the foreign language course grades on the horizontal axis and the verbal aptitude test scores on the 20 vertical axis. The Pearson product-moment correlation coefficient, r, for her sample of 20 40 60 80 data is 0.423515. Ava observes that the data Foreign language grade set for the foreign language course grades, x, and the data set for the verbal aptitude test scores, y, each have a roughly normal distribution. Verbal aptitude test score Compute the P-value for the test statistic for Ava's hypothesis test using software. You may find this list of software manuals helpful. Provide your answer with precision to four decimal places. Avoid rounding until the final step. P-value =

Glencoe Algebra 1, Student Edition, 9780079039897, 0079039898, 2018
18th Edition
ISBN:9780079039897
Author:Carter
Publisher:Carter
Chapter4: Equations Of Linear Functions
Section4.5: Correlation And Causation
Problem 11PPS

Related questions
Question
Transcribed Image Text:Suppose Ava, an education researcher, wants to understand the relationship between foreign language skills and English
verbal aptitude for middle school students in her school district. In order to draw an inference about the population linear
correlation coefficient, p, for foreign language skills and English verbal aptitude, she conducts a hypothesis test at a
significance level of a = 0.05 to determine if there is a significant linear correlation between the two variables.
Ava selects a simple random sample of 33
Verbal aptitude test score vs. foreign language grade
eighth grade students within her school
district. She gathers the students' final seventh
80
grade foreign language course grades and
their test scores from an English verbal
60
aptitude test.
40-
Ava produces a scatter plot with the foreign
language course grades on the horizontal axis
and the verbal aptitude test scores on the
20
vertical axis. The Pearson product-moment
correlation coefficient, r, for her sample of
20
40
60
80
data is 0.423515. Ava observes that the data
Foreign language grade
set for the foreign language course grades, x,
and the data set for the verbal aptitude test scores, y, each have a roughly normal distribution.
Verbal aptitude test score
Transcribed Image Text:Compute the P-value for the test statistic for Ava's hypothesis test using software. You may find this list of software
manuals helpful. Provide your answer with precision to four decimal places. Avoid rounding until the final step.
P-value =
Expert Solution
This question has been solved!
Explore an expertly crafted, step-by-step solution for a thorough understanding of key concepts.

This is a popular solution!

Trending now
This is a popular solution!

Step by step
Solved in 3 steps with 3 images

Recommended textbooks for you
Glencoe Algebra 1, Student Edition, 9780079039897…
Algebra
ISBN:
9780079039897
Author:
Carter
Publisher:
McGraw Hill

Big Ideas Math A Bridge To Success Algebra 1: Stu…
Algebra
ISBN:
9781680331141
Author:
HOUGHTON MIFFLIN HARCOURT
Publisher:
Houghton Mifflin Harcourt
Glencoe Algebra 1, Student Edition, 9780079039897…
Algebra
ISBN:
9780079039897
Author:
Carter
Publisher:
McGraw Hill
Big Ideas Math A Bridge To Success Algebra 1: Stu…
Algebra
ISBN:
9781680331141
Author:
HOUGHTON MIFFLIN HARCOURT
Publisher:
Houghton Mifflin Harcourt