Suppose data collected by observers at randomly selected intersections across the country revealed that in a sample of 250 drivers, 50 were using their cell phone. a. Give a point estimate of a, the true driver cell phone use rate (that is, the true proportion- or- population porportion- of drivers who are using their cell phone while driving). b. Compute a 95% confidence interval for a. c. Give a practical interpretation of the interval, part b. a. A point estimate for x is. b. The 95% confidence interval for the population proportion z is ( D. (Round to two decimal places as needed.) c. Interpret this interval. O A. We are confident that 95% of the population use a cell phone while driving.
Suppose data collected by observers at randomly selected intersections across the country revealed that in a sample of 250 drivers, 50 were using their cell phone. a. Give a point estimate of a, the true driver cell phone use rate (that is, the true proportion- or- population porportion- of drivers who are using their cell phone while driving). b. Compute a 95% confidence interval for a. c. Give a practical interpretation of the interval, part b. a. A point estimate for x is. b. The 95% confidence interval for the population proportion z is ( D. (Round to two decimal places as needed.) c. Interpret this interval. O A. We are confident that 95% of the population use a cell phone while driving.

College Algebra (MindTap Course List)
12th Edition
ISBN:9781305652231
Author:R. David Gustafson, Jeff Hughes
Publisher:R. David Gustafson, Jeff Hughes
Chapter8: Sequences, Series, And Probability
Section8.7: Probability
Problem 58E: What is meant by the sample space of an experiment?

Related questions

Concept explainers
Equations and Inequations
Equations and inequalities describe the relationship between two mathematical expressions.
Linear Functions
A linear function can just be a constant, or it can be the constant multiplied with the variable like x or y. If the variables are of the form, x2, x1/2 or y2 it is not linear. The exponent over the variables should always be 1.
Question
Provide a step-by-step explanation.
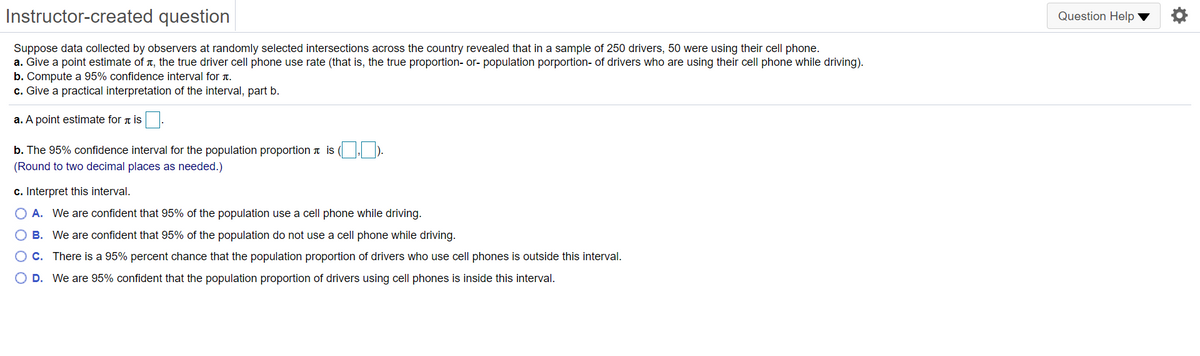
Transcribed Image Text:Instructor-created question
Question Help
Suppose data collected by observers at randomly selected intersections across the country revealed that in a sample of 250 drivers, 50 were using their cell phone.
a. Give a point estimate of T, the true driver cell phone use rate (that is, the true proportion- or- population porportion- of drivers who are using their cell phone while driving).
b. Compute a 95% confidence interval for n.
c. Give a practical interpretation of the interval, part b.
a. A point estimate for t is.
b. The 95% confidence interval for the population proportion a is (,).
(Round to two decimal places as needed.)
c. Interpret this interval.
A. We are confident that 95% of the population use a cell phone while driving.
B. We are confident that 95% of the population do not use a cell phone while driving.
OC. There is a 95% percent chance that the population proportion of drivers who use cell phones is outside this interval.
O D. We are 95% confident that the population proportion of drivers using cell phones is inside this interval.
Expert Solution
This question has been solved!
Explore an expertly crafted, step-by-step solution for a thorough understanding of key concepts.

This is a popular solution!

Trending now
This is a popular solution!

Step by step
Solved in 2 steps

Knowledge Booster


Learn more about
Need a deep-dive on the concept behind this application? Look no further. Learn more about this topic, statistics and related others by exploring similar questions and additional content below.Recommended textbooks for you
College Algebra (MindTap Course List)
Algebra
ISBN:
9781305652231
Author:
R. David Gustafson, Jeff Hughes
Publisher:
Cengage Learning
College Algebra (MindTap Course List)
Algebra
ISBN:
9781305652231
Author:
R. David Gustafson, Jeff Hughes
Publisher:
Cengage Learning