Suppose firms in this economy pay their workers efficiency wages. This practice will likely lead to a adjustment of the economy to its long-run equilibrium because firms will be likely to the wages of their employees.
Suppose firms in this economy pay their workers efficiency wages. This practice will likely lead to a adjustment of the economy to its long-run equilibrium because firms will be likely to the wages of their employees.

Chapter4: Exchange Rate Determination
Section: Chapter Questions
Problem 13QA

Related questions

Question
Suppose firms in this economy pay their workers efficiency wages. This practice will likely lead to a (faster, slower) adjustment of the economy to its long-run equilibrium because firms will be (less, more) likely to (reduce, raise) the wages of their employees.
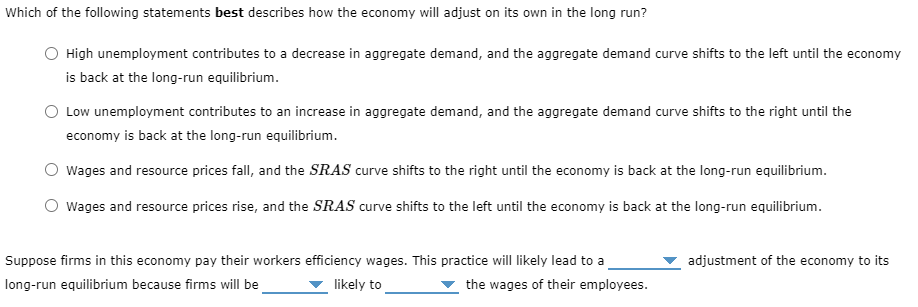
Transcribed Image Text:Which of the following statements best describes how the economy will adjust on its own in the long run?
High unemployment contributes to a decrease in aggregate demand, and the aggregate demand curve shifts to the left until the economy
is back at the long-run equilibrium.
Low unemployment contributes to an increase in aggregate demand, and the aggregate demand curve shifts to the right until the
economy is back at the long-run equilibrium.
Wages and resource prices fall, and the SRAS curve shifts to the right until the economy is back at the long-run equilibrium.
O wages and resource prices rise, and the SRAS curve shifts to the left until the economy is back at the long-run equilibrium.
Suppose firms in this economy pay their workers efficiency wages. This practice will likely lead to a
adjustment of the economy to its
long-run equilibrium because firms will be
likely to
the wages of their employees.
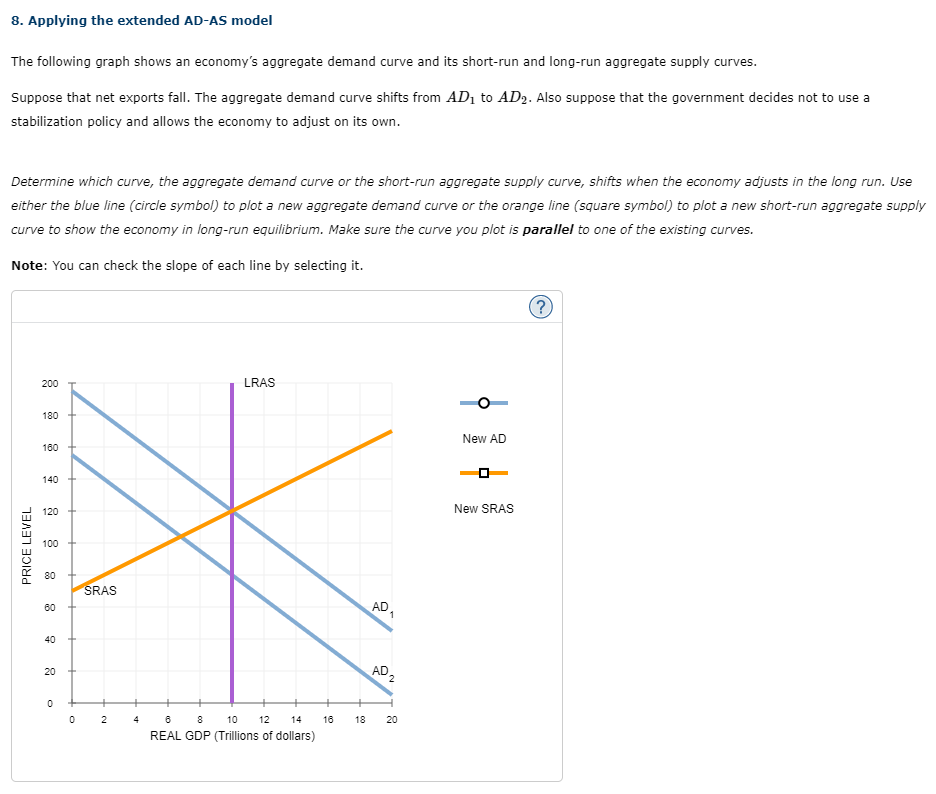
Transcribed Image Text:8. Applying the extended AD-AS model
The following graph shows an economy's aggregate demand curve and its short-run and long-run aggregate supply curves.
Suppose that net exports fall. The aggregate demand curve shifts from ADị to AD2. Also suppose that the government decides not to use a
stabilization policy and allows the economy to adjust on its own.
Determine which curve, the aggregate demand curve or the short-run aggregate supply curve, shifts when the economy adjusts in the long run. Use
either the blue line (circle symbol) to plot a new aggregate demand curve or the orange line (square symbol) to plot a new short-run aggregate supply
curve to show the economy in long-run equilibrium. Make sure the curve you plot is parallel to one of the existing curves.
Note: You can check the slope of each line by selecting it.
(?)
200
LRAS
180
New AD
180
140
120
New SRAS
100
80
SRAS
AD
1
60
40
20
AD.
2
4
10 12
14
16
18
20
REAL GDP (Trillions of dollars)
PRICE LEVEL
Expert Solution
This question has been solved!
Explore an expertly crafted, step-by-step solution for a thorough understanding of key concepts.

This is a popular solution!

Trending now
This is a popular solution!

Step by step
Solved in 2 steps

Knowledge Booster


Learn more about
Need a deep-dive on the concept behind this application? Look no further. Learn more about this topic, finance and related others by exploring similar questions and additional content below.Recommended textbooks for you