Suppose that Darnell and Eleanor are the only suppliers of pizza slices in a particular market. The following table shows their weekly supply schedules: Price Darnell's Quantity Supplied Eleanor's Quantity Supplied (Dollars per slice) (Slices) (Slices) 1 0 4 2 4 7 3 6 9 4 7 10 5 8 11 On the following graph, plot Darnell's supply of pizza slices using the green points (triangle symbol). Next, plot Eleanor's supply of pizza slices using the purple points (diamond symbol). Finally, plot the market supply of pizza slices using the orange points (square symbol).
Suppose that Darnell and Eleanor are the only suppliers of pizza slices in a particular market. The following table shows their weekly supply schedules: Price Darnell's Quantity Supplied Eleanor's Quantity Supplied (Dollars per slice) (Slices) (Slices) 1 0 4 2 4 7 3 6 9 4 7 10 5 8 11 On the following graph, plot Darnell's supply of pizza slices using the green points (triangle symbol). Next, plot Eleanor's supply of pizza slices using the purple points (diamond symbol). Finally, plot the market supply of pizza slices using the orange points (square symbol).

Chapter5: Markets In Motion And Price Controls
Section: Chapter Questions
Problem 10P

Related questions
Question
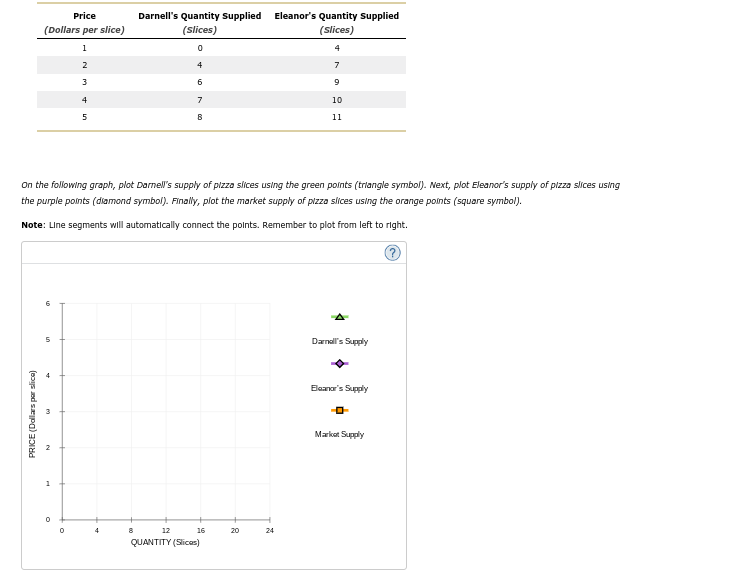
Suppose that Darnell and Eleanor are the only suppliers of pizza slices in a particular market. The following table shows their weekly supply schedules:
|
Price
|
Darnell's Quantity Supplied
|
Eleanor's Quantity Supplied
|
|---|---|---|
|
(Dollars per slice)
|
(Slices)
|
(Slices)
|
| 1 | 0 | 4 |
| 2 | 4 | 7 |
| 3 | 6 | 9 |
| 4 | 7 | 10 |
| 5 | 8 | 11 |
On the following graph, plot Darnell's supply of pizza slices using the green points (triangle symbol). Next, plot Eleanor's supply of pizza slices using the purple points (diamond symbol). Finally, plot the market supply of pizza slices using the orange points (square symbol).
Note: Line segments will automatically connect the points. Remember to plot from left to right.
Transcribed Image Text:Price
(Dollars per slice)
PRICE (Dollars par slice)
5
m
N
On the following graph, plot Darell's supply of pizza slices using the green points (triangle symbol). Next, plot Eleanor's supply of pizza slices using
the purple points (diamond symbol). Finally, plot the market supply of pizza slices using the orange points (square symbol).
Note: Line segments will automatically connect the points. Remember to plot from left to right.
1
0
1
0
2
3
4
5
4
Darnell's Quantity Supplied Eleanor's Quantity Supplied
(Slices)
(Slices)
0
4
4
7
6
9
7
8
8
12
16
QUANTITY (Slices)
20
10
11
24
4
Darnell's Supply
Eleanor's Supply
-0-
Market Supply
?
Expert Solution
This question has been solved!
Explore an expertly crafted, step-by-step solution for a thorough understanding of key concepts.

Step by step
Solved in 2 steps with 1 images

Knowledge Booster


Learn more about
Need a deep-dive on the concept behind this application? Look no further. Learn more about this topic, economics and related others by exploring similar questions and additional content below.Recommended textbooks for you
Exploring Economics
Economics
ISBN:
9781544336329
Author:
Robert L. Sexton
Publisher:
SAGE Publications, Inc

Essentials of Economics (MindTap Course List)
Economics
ISBN:
9781337091992
Author:
N. Gregory Mankiw
Publisher:
Cengage Learning

Brief Principles of Macroeconomics (MindTap Cours…
Economics
ISBN:
9781337091985
Author:
N. Gregory Mankiw
Publisher:
Cengage Learning
Exploring Economics
Economics
ISBN:
9781544336329
Author:
Robert L. Sexton
Publisher:
SAGE Publications, Inc
Essentials of Economics (MindTap Course List)
Economics
ISBN:
9781337091992
Author:
N. Gregory Mankiw
Publisher:
Cengage Learning
Brief Principles of Macroeconomics (MindTap Cours…
Economics
ISBN:
9781337091985
Author:
N. Gregory Mankiw
Publisher:
Cengage Learning


Principles of Economics 2e
Economics
ISBN:
9781947172364
Author:
Steven A. Greenlaw; David Shapiro
Publisher:
OpenStax