Suppose that Manuel and Poornima are the only consumers of shoes in a particular market. The following table shows their annual demand schedules Manuel's Quantity Demanded Poornima's Quantity Demanded Price (Dollars per pair) (Pairs) (Pairs) 10 32 56 20 20 40 30 12 24 40 12 50 4 On the following graph, plot Manuel's demand for shoes using the green points (triangle symbol). Next, plot Poornima's demand for shoes using the purple points (diamond symbol). Finally, plot the market demand for shoes using the blue points (circle symbol). Note: Line segments will automatically connect the points. Remember to plot from left to right. 80 50 Manuel's Demand 40 Poomima's Demand 30 Market Demand 10 18 32 48 04 80 QUANTITY (Pairs) PRICE (Dollars per pair)
Suppose that Manuel and Poornima are the only consumers of shoes in a particular market. The following table shows their annual demand schedules Manuel's Quantity Demanded Poornima's Quantity Demanded Price (Dollars per pair) (Pairs) (Pairs) 10 32 56 20 20 40 30 12 24 40 12 50 4 On the following graph, plot Manuel's demand for shoes using the green points (triangle symbol). Next, plot Poornima's demand for shoes using the purple points (diamond symbol). Finally, plot the market demand for shoes using the blue points (circle symbol). Note: Line segments will automatically connect the points. Remember to plot from left to right. 80 50 Manuel's Demand 40 Poomima's Demand 30 Market Demand 10 18 32 48 04 80 QUANTITY (Pairs) PRICE (Dollars per pair)

Microeconomics: Principles & Policy
14th Edition
ISBN:9781337794992
Author:William J. Baumol, Alan S. Blinder, John L. Solow
Publisher:William J. Baumol, Alan S. Blinder, John L. Solow
Chapter4: Supply And Demand: An Initial Look
Section: Chapter Questions
Problem 3TY

Related questions
Question
i need help with this microeconmics question 4
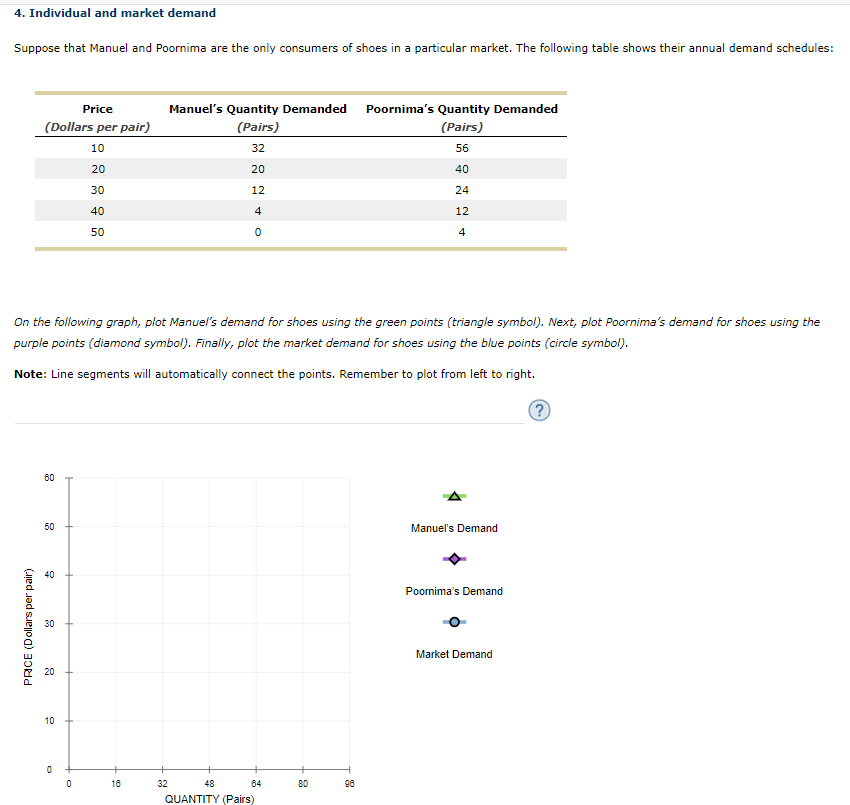
Transcribed Image Text:Suppose that Manuel and Poornima are the only consumers of shoes in a particular market. The following table shows their annual demand schedules
Manuel's Quantity Demanded Poornima's Quantity Demanded
Price
(Dollars per pair)
(Pairs)
(Pairs)
10
32
56
20
20
40
30
12
24
40
12
50
4
On the following graph, plot Manuel's demand for shoes using the green points (triangle symbol). Next, plot Poornima's demand for shoes using the
purple points (diamond symbol). Finally, plot the market demand for shoes using the blue points (circle symbol).
Note: Line segments will automatically connect the points. Remember to plot from left to right.
80
50
Manuel's Demand
40
Poomima's Demand
30
Market Demand
10
18
32
48
04
80
QUANTITY (Pairs)
PRICE (Dollars per pair)
Expert Solution
This question has been solved!
Explore an expertly crafted, step-by-step solution for a thorough understanding of key concepts.

This is a popular solution!

Trending now
This is a popular solution!

Step by step
Solved in 3 steps with 4 images

Knowledge Booster


Learn more about
Need a deep-dive on the concept behind this application? Look no further. Learn more about this topic, economics and related others by exploring similar questions and additional content below.Recommended textbooks for you
Microeconomics: Principles & Policy
Economics
ISBN:
9781337794992
Author:
William J. Baumol, Alan S. Blinder, John L. Solow
Publisher:
Cengage Learning

Principles of Economics 2e
Economics
ISBN:
9781947172364
Author:
Steven A. Greenlaw; David Shapiro
Publisher:
OpenStax

Microeconomics: Principles & Policy
Economics
ISBN:
9781337794992
Author:
William J. Baumol, Alan S. Blinder, John L. Solow
Publisher:
Cengage Learning
Principles of Economics 2e
Economics
ISBN:
9781947172364
Author:
Steven A. Greenlaw; David Shapiro
Publisher:
OpenStax

Economics Today and Tomorrow, Student Edition
Economics
ISBN:
9780078747663
Author:
McGraw-Hill
Publisher:
Glencoe/McGraw-Hill School Pub Co

Exploring Economics
Economics
ISBN:
9781544336329
Author:
Robert L. Sexton
Publisher:
SAGE Publications, Inc
