Suppose that the tuna industry is in long-run equilibrium at a price of $5 per can of tuna and a quantity of 200 million cans per year. Suppose the Public Health Agency of Canada (PHAC) issues a report saying that eating tuna is bad for your health. 1st GRAPH: The PHAC's report will cause consumers to demand ____ (less OR more) tuna at every price. In the short run, firms will respond by ______ (exiting the industry OR producing the same amount of tuna and running at a loss OR producing less tuna and running at a loss OR producing more tuna and earning positive profit OR entering the industry OR producing the same amount of tuna and earning positive profits) In the long run, some firms will respond by ______ (producing more tuna and earning positive profit OR producing less tuna and running at a loss OR exiting the industry OR producing less tuna and earning positive profit OR entering the industry OR producing more tuna and running at a loss) until _______ (tuna population grow large enough to support more firms OR consumer demand returns to its original level OR new technologies are discovered that lower costs OR each firm in the industry is once again earning zero profit) 2nd GRAPH: The new equilibrium price and quantity suggest that the shape of the long-run supply curve in this industry is _________(upward scali
Suppose that the tuna industry is in long-run equilibrium at a price of $5 per can of tuna and a quantity of 200 million cans per year. Suppose the Public Health Agency of Canada (PHAC) issues a report saying that eating tuna is bad for your health. 1st GRAPH: The PHAC's report will cause consumers to demand ____ (less OR more) tuna at every price. In the short run, firms will respond by ______ (exiting the industry OR producing the same amount of tuna and running at a loss OR producing less tuna and running at a loss OR producing more tuna and earning positive profit OR entering the industry OR producing the same amount of tuna and earning positive profits) In the long run, some firms will respond by ______ (producing more tuna and earning positive profit OR producing less tuna and running at a loss OR exiting the industry OR producing less tuna and earning positive profit OR entering the industry OR producing more tuna and running at a loss) until _______ (tuna population grow large enough to support more firms OR consumer demand returns to its original level OR new technologies are discovered that lower costs OR each firm in the industry is once again earning zero profit) 2nd GRAPH: The new equilibrium price and quantity suggest that the shape of the long-run supply curve in this industry is _________(upward scali

Chapter11: Profit Maximization
Section: Chapter Questions
Problem 11.11P

Related questions
Question
Suppose that the tuna industry is in long-run equilibrium at a price of $5 per can of tuna and a quantity of 200 million cans per year. Suppose the Public Health Agency of Canada (PHAC) issues a report saying that eating tuna is bad for your health.
1st GRAPH:
The PHAC's report will cause consumers to demand ____ (less OR more) tuna at every price. In the short run, firms will respond by ______ (exiting the industry OR producing the same amount of tuna and running at a loss OR producing less tuna and running at a loss OR producing more tuna and earning positive profit OR entering the industry OR producing the same amount of tuna and earning positive profits)
In the long run, some firms will respond by ______ (producing more tuna and earning positive profit OR producing less tuna and running at a loss OR exiting the industry OR producing less tuna and earning positive profit OR entering the industry OR producing more tuna and running at a loss) until _______ (tuna population grow large enough to support more firms OR consumer demand returns to its original level OR new technologies are discovered that lower costs OR each firm in the industry is once again earning zero profit)
2nd GRAPH:
The new equilibrium price and quantity suggest that the shape of the long-run supply curve in this industry is _________(upward scaling OR downward sloping OR verticle OR horizontal) in the long run.
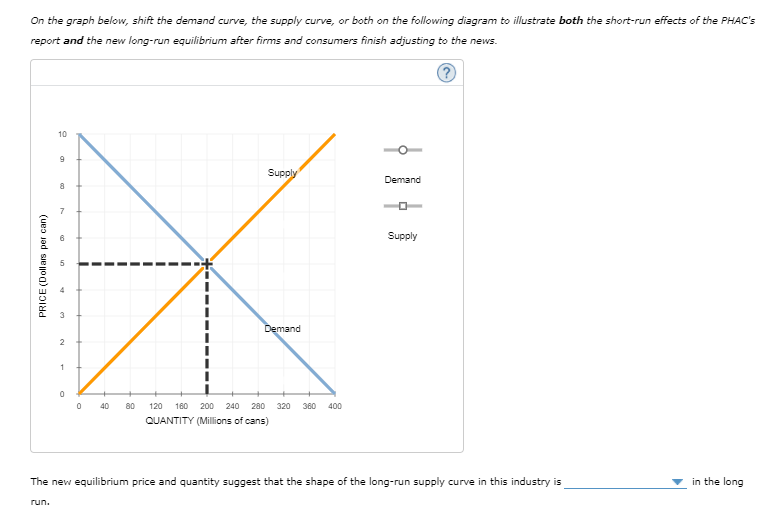
Transcribed Image Text:On the graph below, shift the demand curve, the supply curve, or both on the following diagram to illustrate both the short-run effects of the PHAC's
report and the new long-run equilibrium after firms and consumers finish adjusting to the news.
10
Supply
Demand
7
Supply
4
3
Demand
1
40
80
120
160 200
240
280
320
360
400
QUANTITY (Millions of cans)
The new equilibrium price and quantity suggest that the shape of the long-run supply curve in this industry is
in the long
run.
PRICE (Dollars per can)
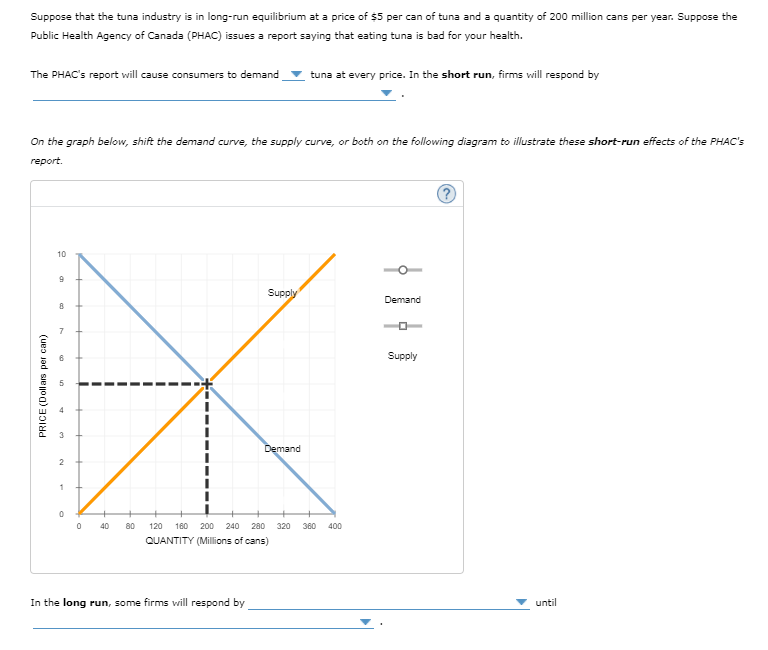
Transcribed Image Text:Suppose that the tuna industry is in long-run equilibrium at a price of $5 per can of tuna and a quantity of 200 million cans per year. Suppose the
Public Health Agency of Canada (PHAC) issues a report saying that eating tuna is bad for your health.
The PHAC's report will cause consumers to demand
tuna at every price. In the short run, firms will respond by
On the graph below, shift the demand curve, the supply curve, or both on the following diagram to illustrate these short-run effects of the PHAC's
reрort.
10
Supply
Demand
7
Supply
4.
Demand
40
80
120
160 200
240
280
320
360
400
QUANTITY (Millions of cans)
In the long run, some firms will respond by
until
PRICE (Dollars per can)
Expert Solution
This question has been solved!
Explore an expertly crafted, step-by-step solution for a thorough understanding of key concepts.

Step by step
Solved in 2 steps

Knowledge Booster


Learn more about
Need a deep-dive on the concept behind this application? Look no further. Learn more about this topic, economics and related others by exploring similar questions and additional content below.Recommended textbooks for you