Suppose that we are testing Ho: u = 4 vs Ha:u > 4. A p-value of 0.023 was determined. Which of the following is a correct interpretation of this p-value? (a) The null hypothesis would be rejected at a 5% level but not a 1% level. (b) The null hypothesis would be rejected at a 1% level but not a 5% level.
Suppose that we are testing Ho: u = 4 vs Ha:u > 4. A p-value of 0.023 was determined. Which of the following is a correct interpretation of this p-value? (a) The null hypothesis would be rejected at a 5% level but not a 1% level. (b) The null hypothesis would be rejected at a 1% level but not a 5% level.

MATLAB: An Introduction with Applications
6th Edition
ISBN:9781119256830
Author:Amos Gilat
Publisher:Amos Gilat
Chapter1: Starting With Matlab
Section: Chapter Questions
Problem 1P

Related questions
Question
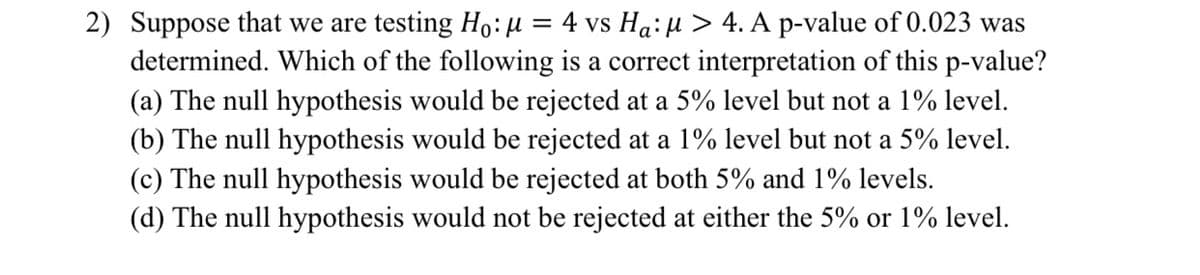
Transcribed Image Text:2) Suppose that we are testing Ho:µ = 4 vs Ha: µ > 4. A p-value of 0.023 was
determined. Which of the following is a correct interpretation of this p-value?
(a) The null hypothesis would be rejected at a 5% level but not a 1% level.
(b) The null hypothesis would be rejected at a 1% level but not a 5% level.
(c) The null hypothesis would be rejected at both 5% and 1% levels.
(d) The null hypothesis would not be rejected at either the 5% or 1% level.
Expert Solution
This question has been solved!
Explore an expertly crafted, step-by-step solution for a thorough understanding of key concepts.

This is a popular solution!

Trending now
This is a popular solution!

Step by step
Solved in 2 steps

Recommended textbooks for you
MATLAB: An Introduction with Applications
Statistics
ISBN:
9781119256830
Author:
Amos Gilat
Publisher:
John Wiley & Sons Inc

Probability and Statistics for Engineering and th…
Statistics
ISBN:
9781305251809
Author:
Jay L. Devore
Publisher:
Cengage Learning

Statistics for The Behavioral Sciences (MindTap C…
Statistics
ISBN:
9781305504912
Author:
Frederick J Gravetter, Larry B. Wallnau
Publisher:
Cengage Learning
MATLAB: An Introduction with Applications
Statistics
ISBN:
9781119256830
Author:
Amos Gilat
Publisher:
John Wiley & Sons Inc
Probability and Statistics for Engineering and th…
Statistics
ISBN:
9781305251809
Author:
Jay L. Devore
Publisher:
Cengage Learning
Statistics for The Behavioral Sciences (MindTap C…
Statistics
ISBN:
9781305504912
Author:
Frederick J Gravetter, Larry B. Wallnau
Publisher:
Cengage Learning

Elementary Statistics: Picturing the World (7th E…
Statistics
ISBN:
9780134683416
Author:
Ron Larson, Betsy Farber
Publisher:
PEARSON

The Basic Practice of Statistics
Statistics
ISBN:
9781319042578
Author:
David S. Moore, William I. Notz, Michael A. Fligner
Publisher:
W. H. Freeman

Introduction to the Practice of Statistics
Statistics
ISBN:
9781319013387
Author:
David S. Moore, George P. McCabe, Bruce A. Craig
Publisher:
W. H. Freeman