Suppose the correlation between N and W is 0.2. What is oy4w (rounded to four decimal places)?
Suppose the correlation between N and W is 0.2. What is oy4w (rounded to four decimal places)?

Chapter8: Sequences, Series,and Probability
Section8.7: Probability
Problem 11ECP: A manufacturer has determined that a machine averages one faulty unit for every 500 it produces....

Related questions
Question
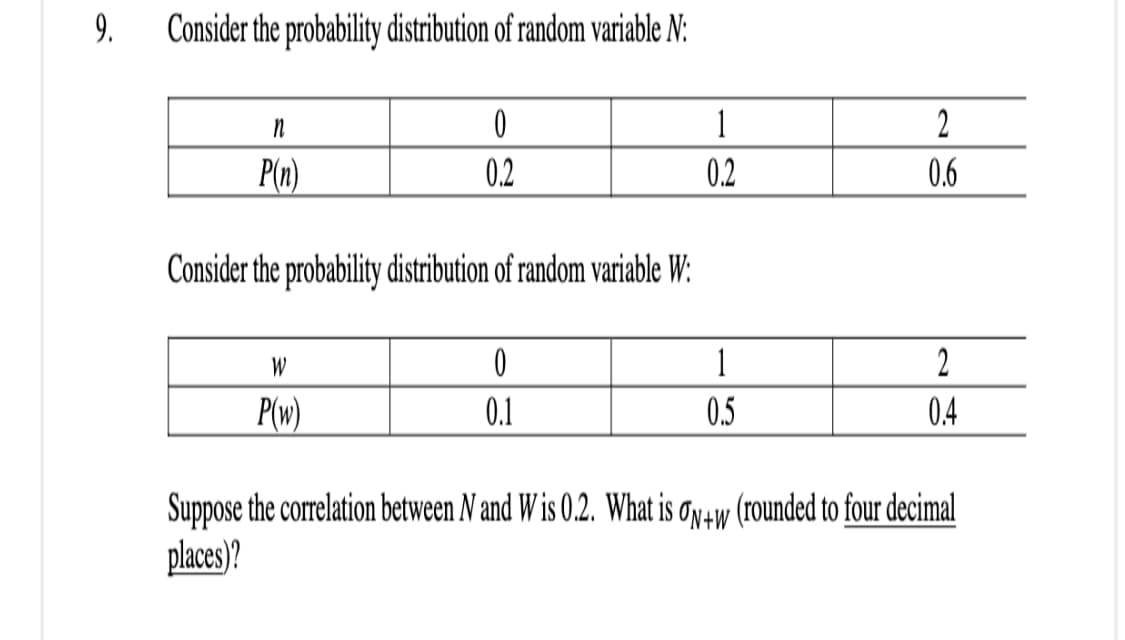
Transcribed Image Text:9.
Consider the probability distribution of random variable N:
1
2
P(n)
0.2
0.2
0.6
Consider the probability distribution of random variable W:
W
1
2
P(w)
0.1
0.5
0.4
Suppose the correlation between N and W is 0.2. What is oy4w (rounded to four decimal
places)?
Expert Solution
This question has been solved!
Explore an expertly crafted, step-by-step solution for a thorough understanding of key concepts.

Step by step
Solved in 3 steps with 3 images

Recommended textbooks for you

Holt Mcdougal Larson Pre-algebra: Student Edition…
Algebra
ISBN:
9780547587776
Author:
HOLT MCDOUGAL
Publisher:
HOLT MCDOUGAL
Holt Mcdougal Larson Pre-algebra: Student Edition…
Algebra
ISBN:
9780547587776
Author:
HOLT MCDOUGAL
Publisher:
HOLT MCDOUGAL