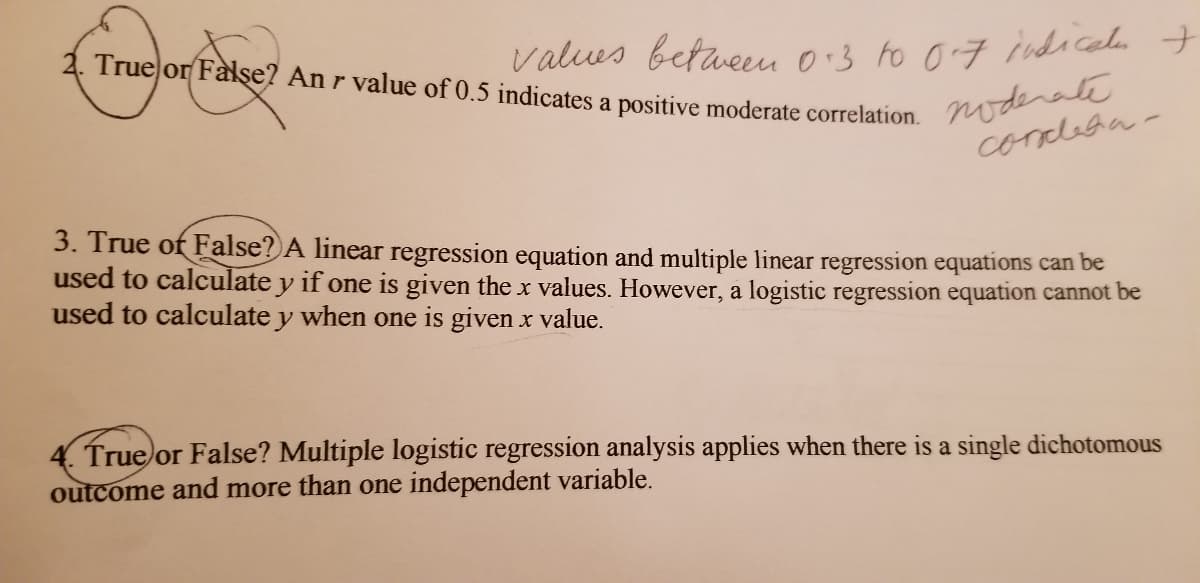
2. True or Fàlşe? An r value of 0.5 indicates a positive moderate correlation. values betueeu 0:3 to 07 udr nodera


Q: b. Is the correlation significant using a=.01? c. State the conclusion in APA format.
A: Given α=0.01
Q: ssume we have met the assumptions of using Pearson's correlation. If we wanted to test whether…
A: Given Information: No. of variables=02Given variables=1. Postnatal depression scores2. antenatal…
Q: A correlation study provides the following data: r = .66 and the study involved 92 participants What…
A: The number of participants involved are 92.
Q: 12. Which of these situations could be analyzed with correlational analysis? a. A comparison of two…
A: Correlational analysis involves various methods and techniques for measuring the extent of the…
Q: b. What is the value of the correlation coefficient for all 10 data points? (Simplify your answer.…
A: The scatterplot is given with 10 points.
Q: Suppose you measured variables X and Y on a sample 10 students. Let X = {1, 2, 3, 4, 5, 6, 7, 8, 9,…
A: We know that, X and Y two variables then we will find the linear relationship between two variable…
Q: What is the most plausible value for the correlation between spending on tobacco and spending on…
A: A Scatter plot is a non-mathematical representation of data, that shows the degree of relationship…
Q: You wish to determine if there is a negative linear correlation between the two variables at a…
A: Claim : There is a negative linear correlation between the two variables. Based on the above claim…
Q: At the .01 significance level, does the data below show significant correlation? y 5 35.23 37.66 7…
A: Given :
Q: The table below shows the summary statistics of two variables for correlation analysis. Weight at…
A: d. SPSS extracted 510 cases which did not violate any assumptions for correlation analysis.…
Q: Before beginning a new and costly advertising campaign, Starbucks would like to know how best to…
A:
Q: A researcher assesses self-esteem among college students at the beginning of the semester using a…
A:
Q: Which of the following descriptive statistics is a measure of dispersion? a. correlation b.standard…
A: Descriptive statistic is a summary statistics. Descriptive statistic numerically describes the basic…
Q: Before beginning a new and costly advertising campaign, Starbucks would like to know how best to…
A: Given data, Coffee Female Male Consumes more than 2 cups 560 295 Consumes 1-2 cups 163 72…
Q: A researcher wanted to investigate whether life satisfaction differed between high school students,…
A: It is given that the researcher wants to test whether the life satisfaction differed between high…
Q: Before beginning a new and costly advertising campaign, Starbucks would like to know how best to…
A: Given Information : Before beginning a new and costly advertising campaign , Starbucks would like to…
Q: One weekend, a statistician notices that some of the cars in his neighborhood are very clean and…
A: Note- As per our policy we can answer only the first 3 sub-parts of a question. If you want…
Q: 17 5 O Yes, significant correlation O No
A: Data is given to test the correlation
Q: It is well known that similarity in attitudes, beliefs, and interests plays an important role in…
A: Given Information: Couple Wife Husband A 2 8 B 5 4 C 2 3 D 1 6 E 4 3 F 3 5 G 5 4…
Q: What is the sample size of this study, that is, how many observations (data pairs) are there? Which…
A:
Q: Please also explain why you determined whether or not the results are statistically significant. The…
A: The sample size is 137 and the correlation between two variables is -0.78.
Q: 2. Calculate a Pearson correlation for the scores below. Y 10 6. 7. 8. 10 97869
A: X Y 10 6 9 7 8. 8 7 9 6 10
Q: To examine the linear correlation between adult age and weight, data was collected from 9 adults.…
A: We have to test that if the correlation coefficient between two variables is significant.for that we…
Q: Scatterplots for two different datasets are shown below. For which set of data is the p-value for a…
A: Solution: Scatter Plot: If we plot the points (xi, yi) corresponding to two variables then the…
Q: 24. Aside from testing differences, The Pearson Chi-square is also used to test correlation when…
A: Pearson chi square test used for testing goodness of fit , independence and homogeneity
Q: The personal director of an engineering company believes that there is a significant positive…
A: 1] n=10 2] level of significance α=5%
Q: Is the correlation significant at α=0.05? Use the table of critical values for R to decide Sample 27…
A: Solution-: Given: n=27,R=0.775 We check, Is the correlation significant at α=0.05?
Q: Before beginning a new and costly advertising campaign, Starbucks would like to know how best to…
A: a) Level of significance = 0.01 Claim: Test whether there is any association between gender and…
Q: Which correlation coefficient is appropriate to employ in determining the relationship between…
A: In the given question we have to find the appropriate correlation coefficient for relationship…
Q: Average daily darkness (h) Wildlife-vehicle incidents 10.2 76 10.4 81 10.6 96 11 66 11.2 114 11.8 93…
A: Let X represents the average daily darkness and Y represents the wildlife vehicles incidents.…
Q: Which of the following conclusion would represent a Type I error? Concluding that the movie will…
A: Type - I error : In a statistical hypothesis testing, the rejection of a true null hypothesis is…
Q: The following sample observations were randomly selected. 6 3. 4 4 y 13 15 7 12 13 11 9 5 Click here…
A: The mean of variable x and y is calculated as follows, x=∑i=1nxin=398=4.88y=∑i=1nyin=858=10.63 We…
Q: ALLY 5. Calculate correlation coefficient for the following data without taking deviations of items…
A:
Q: It is well known that similarity in attitudes, beliefs, and interests plays an important role in…
A: Correlation Coefficient : The correlation coefficient is a unit-less quantity. It is a standard…
Q: What analysis should I use to test the following correlation between the following variables: 1.…
A: Correlation measures association between variables. The correct choice of correlation statistic…
Q: Which of the following is a measure of dispersion? Standard Deviation Mean Median Correlation Count
A: To find which of the following is a measure of dispersion :-
Q: c. At the 0.05 significance level, can we conclude there is a significant positive correlation?…
A: Correlation: Software procedure for correlation in EXCEL. Enter the given data in EXCEL sheet. Go…
Q: otheses, which of the following would be ng data with a low test statistic
A: In testing hypotheses, which of the following would be strong evidence against the null hypothesis?
Q: Use the table below to answer the following questions: (a) Find the value of the linear correlation…
A: Use the table below to answer the following questions: (a) Find the value of the linear correlation…
Q: 1. Which data set indicates the strongest positive linear Choose one relationship between its two…
A: Q1)Figure 1 has the perfect positive correlation as all the points are on the straight line. Q2)…
Q: If the correlation coefficient value for the two variables is 0.865 with sample size 15 each. What…
A:
Q: Which of the following tests is appropriate, if we want to determine the relationship between…
A: We have given that, Which of the following tests is appropriate, if we want to determine the…
Q: a. Use the four steps of hypothesis testing and calculate a Pearson correlation for the above data,…
A: Since you have posted a question with multiple sub-parts, we will solve first three sub-parts for…
Q: To examine the linear correlation between adult age and weight, data was collected from 10 adults.…
A: The following data table is provided. x y 28 139 31 192 32 123 33 206 39 210 41 219…
Q: The table below shows the summary statistics of two variables for correlation analysis. Descriptive…
A: Given information: The table of summary statistics for two variables. Mean Standard deviation N…
Q: The following sample observations were randomly selected. X: 5 3 6 3 4 4 6 8 Y: 13 15 7 12 13 11 9…
A: The observations of X and Y are given. Sample size 'n' is 8.
Q: Determine if there is a significant negative correlation between the sets of data at a 10%…
A: From the given information, the claim of the problem is the significant negative correlation between…
Q: 1. FILE The following sample of observations were randomly selected. 3 6 10 4 4 6. Determine the…
A: Since you have asked multiple question, we will solve the first question for you. If you want any…
Q: A statistic teacher recorded the Math and Science test scores of twelve students from one section.…
A: Correlation between X and Y: r=0.922.

Step by step
Solved in 2 steps


- Sales of a video game released in the year 2000 took off at first, but then steadily slowed as time moved on. Table 4 shows the number of games sold, in thousands, from the years 20002010. a. Let x represent time in years starting with x=1 for the year 2000. Let y represent the number of games sold in thousands. Use logarithmic regression to fit a model to these data. b. If games continue to sell at this rate, how many games will sell in 2015? Round to the nearest thousand.World Population The following table shows world population N, in billions, in the given year. Year 1950 1960 1970 1980 1990 2000 2010 N 2.56 3.04 3.71 4.45 5.29 6.09 6.85 a. Use regression to find a logistic model for world population. b. What r value do these data yield for humans on planet Earth? c. According to the logistic model using these data, what is the carrying capacity of planet Earth for humans? d. According to this model, when will world population reach 90 of carrying capacity? Round to the nearest year. Note: This represents a rather naive analysis of world population.Long-Term Data and the Carrying Capacity This is a continuation of Exercise 13. Ideally, logistic data grow toward the carrying capacity but never go beyond this limiting value. The following table shows additional data on paramecium cells. t 12 13 14 15 16 17 18 19 20 N 610 513 593 557 560 522 565 517 500 a. Add these data to the graph in part b of Exercise 13. b. Comment on the relationship of the data to the carrying capacity. Paramecium Cells The following table is adapted from a paramecium culture experiment conducted by Cause in 1934. The data show the paramecium population N as a function of time t in days. T 2 3 5 6 8 9 10 11 N 14 34 94 189 330 416 507 580 a. Use regression to find a logistic model for this population. b. Make a graph of the model you found in part a. c. According to the model you made in part a, when would the population reach 450?
- Special Rounding Instructions When you perform logistic regression, round the r value to three decimal places and the other parameters to two decimal places. Round all answers to two decimal places unless other-wise indicated. An Epidemic In a city of half a million, there are initially 800 cases of a particularly virulent strain of flu. The Centers for Disease Control and Prevention in Atlanta claims that the cumulative number of infections with this flu strain will increase by 40 per week if there are no limiting factors. Make a logistic model of the potential cumulative number of cases of flu as a function of weeks from initial outbreak, and determine how long it will be before 100, 000 people are infected.Special Rounding Instructions When you perform logistic regression, round the r value to three decimal places and the other parameters to two decimal places. Round all answers to two decimal places unless other-wise indicated. Fluorescent Bulbs Compact fluorescent light bulbs save energy when compared with traditional incandescent bulbs. Our green energy campaign includes efforts to get local residents to exchange their incandescent bulbs fur fluorescent bulbs. Initially 200 households make the change. Market studies suggest that, in the absence of limiting factors, we could increase that number by 25 each month. In our target area, there are 250,000 households, which we take as the limiting value. Make a logistic model that gives the number of households converting to fluorescent bulbs after t months.Olympic Pole Vault The graph in Figure 7 indicates that in recent years the winning Olympic men’s pole vault height has fallen below the value predicted by the regression line in Example 2. This might have occurred because when the pole vault was a new event there was much room for improvement in vaulters’ performances, whereas now even the best training can produce only incremental advances. Let’s see whether concentrating on more recent results gives a better predictor of future records. (a) Use the data in Table 2 (page 176) to complete the table of winning pole vault heights shown in the margin. (Note that we are using x=0 to correspond to the year 1972, where this restricted data set begins.) (b) Find the regression line for the data in part ‚(a). (c) Plot the data and the regression line on the same axes. Does the regression line seem to provide a good model for the data? (d) What does the regression line predict as the winning pole vault height for the 2012 Olympics? Compare this predicted value to the actual 2012 winning height of 5.97 m, as described on page 177. Has this new regression line provided a better prediction than the line in Example 2?
- What situations are best modeled by a logistic equation? Give an example, and state a case for why the example is a good fit.Special Rounding Instructions When you perform logistic regression, round the r value to three decimal places and the other parameters to two decimal places. Round all answers to two decimal places unless other-wise indicated. Magazine Sales Our new magazine initially sells 300 copies per month. Research indicates that a vigorous advertising campaign could increase sales by 20 each month if our market were unlimited. But research also indicates that magazine sales in our area are unlikely to exceed 1200 per month. Make a logistic model of projected magazine sales.Table 6 shows the population, in thousands, of harbor seals in the Wadden Sea over the years 1997 to 2012. a. Let x represent time in years starting with x=0 for the year 1997. Let y represent the number of seals in thousands. Use logistic regression to fit a model to these data. b. Use the model to predict the seal population for the year 2020. c. To the nearest whole number, what is the limiting value of this model?
- Cable TV The following table shows the number C. in millions, of basic subscribers to cable TV in the indicated year These data are from the Statistical Abstract of the United States. Year 1975 1980 1985 1990 1995 2000 C 9.8 17.5 35.4 50.5 60.6 60.6 a. Use regression to find a logistic model for these data. b. By what annual percentage would you expect the number of cable subscribers to grow in the absence of limiting factors? c. The estimated number of subscribers in 2005 was 65.3million. What light does this shed on the model you found in part a?Special Rounding instructions When you perform logistic regression, round the r value to three decimal places and other parameters to two decimal places. Round all answers to two decimals places unless otherwise indicated. Ebola Figure 5.14 shows a plot of the total number E of Ebola cases in West Africa reported to the centers for Diseases control and Prevention from April 1, 2014, through December 1, 2015. A logistic fit for these data is given by, E=27,841.421+134.65e0.646t. Where t is the time in months since April 1, 2014. In figure 5.15, we have added the graph of this model. a.Does Figure 5.14 show a continuing epidemic or a health crisis that is under control by December 2015? b.According to the model, what was the total number of cases when the disease was spreading at the fastest rate? Round your answer to the nearest whole number. c.Use the crossing- graphs method to determine when the disease was growing at the fastest rate. Round your answer, in months, to one decimal place.Special Rounding Instructions For this exercise set, round all regression parameters to three decimal places, but round all other answers to two decimal places unless otherwise indicated. Rare Coins The table below shows the estimated value C, in dollars, of an 1877 Indian Head Cent Philadelphia mint mark in very fine condition t years after 1950. t=time,inyearssince1950 C=value,indollars 0 25 30 400 45 625 54 1750 60 2000 a.Use exponential regression to model C as an exponential function of t. b.According to your exponential model, by what percentage does the value of the 1877 cent increase from year to year?


