Suppose we run a multiple regression model with 3 predictors, and find the followir summary output and variance-covariance matrix of the estimators. Coefficients: х1 x2 x3 Estimate Std. Error t value Pr(>|t|) (Intercept) -0.1656 0.6135 -0.270 0.788 XXXXX XXXX XXXX 2.4816 -0.420 0.677 1.5866 -0.225 0.823 3.5200 -1.0411 -0.3563 Residual standard error: 0.967 on 46 degrees of freedom
Suppose we run a multiple regression model with 3 predictors, and find the followir summary output and variance-covariance matrix of the estimators. Coefficients: х1 x2 x3 Estimate Std. Error t value Pr(>|t|) (Intercept) -0.1656 0.6135 -0.270 0.788 XXXXX XXXX XXXX 2.4816 -0.420 0.677 1.5866 -0.225 0.823 3.5200 -1.0411 -0.3563 Residual standard error: 0.967 on 46 degrees of freedom

Functions and Change: A Modeling Approach to College Algebra (MindTap Course List)
6th Edition
ISBN:9781337111348
Author:Bruce Crauder, Benny Evans, Alan Noell
Publisher:Bruce Crauder, Benny Evans, Alan Noell
Chapter5: A Survey Of Other Common Functions
Section5.6: Higher-degree Polynomials And Rational Functions
Problem 1TU: The following fictitious table shows kryptonite price, in dollar per gram, t years after 2006. t=...

Related questions
Question
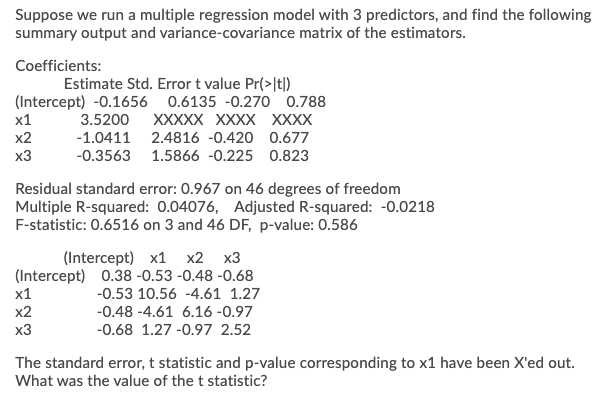
Transcribed Image Text:Suppose we run a multiple regression model with 3 predictors, and find the following
summary output and variance-covariance matrix of the estimators.
Coefficients:
Estimate Std. Error t value Pr(>|t|)
(Intercept) -0.1656 0.6135 -0.270 0.788
х1
3.5200
XXXXX XXXX XXXX
х2
-1.0411 2.4816 -0.420 0.677
x3
-0.3563 1.5866 -0.225 0.823
Residual standard error: 0.967 on 46 degrees of freedom
Multiple R-squared: 0.04076, Adjusted R-squared: -0.0218
F-statistic: 0.6516 on 3 and 46 DF, p-value: 0.586
(Intercept) х1 х2 х3
(Intercept) 0.38 -0.53 -0.48 -0.68
х1
-0.53 10.56 -4.61 1.27
х2
-0.48 -4.61 6.16 -0.97
x3
-0.68 1.27 -0.97 2.52
The standard error, t statistic and p-value corresponding to x1 have been X'ed out.
What was the value of the t statistic?
Expert Solution
This question has been solved!
Explore an expertly crafted, step-by-step solution for a thorough understanding of key concepts.

Step by step
Solved in 2 steps

Recommended textbooks for you
Functions and Change: A Modeling Approach to Coll…
Algebra
ISBN:
9781337111348
Author:
Bruce Crauder, Benny Evans, Alan Noell
Publisher:
Cengage Learning

Linear Algebra: A Modern Introduction
Algebra
ISBN:
9781285463247
Author:
David Poole
Publisher:
Cengage Learning

College Algebra
Algebra
ISBN:
9781305115545
Author:
James Stewart, Lothar Redlin, Saleem Watson
Publisher:
Cengage Learning
Functions and Change: A Modeling Approach to Coll…
Algebra
ISBN:
9781337111348
Author:
Bruce Crauder, Benny Evans, Alan Noell
Publisher:
Cengage Learning
Linear Algebra: A Modern Introduction
Algebra
ISBN:
9781285463247
Author:
David Poole
Publisher:
Cengage Learning
College Algebra
Algebra
ISBN:
9781305115545
Author:
James Stewart, Lothar Redlin, Saleem Watson
Publisher:
Cengage Learning

Glencoe Algebra 1, Student Edition, 9780079039897…
Algebra
ISBN:
9780079039897
Author:
Carter
Publisher:
McGraw Hill