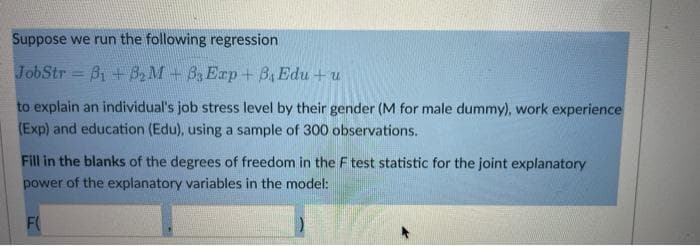
Suppose we run the following regression JobStr B1 +B2 M+B Erp+ B, Edu + u to explain an individual's job stress level by their gender (M for male dummy), work experience (Exp) and education (Edu), using a sample of 300 observations. Fill in the blanks of the degrees of freedom in the F test statistic for the joint explanatory power of the explanatory variables in the model: F


Q: In a single-factor ANOVA if the value of MSreatments = 50 and MSE = 10, the value of the test…
A: For the given data Find test statistic = ?
Q: According to "Reproductive Biology of the Aquatic Salamander Amphiuma tridactylum in Louisiana,"†…
A: Solution Given Information
Q: An artičle in the ACT Materials Journal (Vol. 84, 1987, pp. 213-216) describes several experiments…
A:
Q: Let n, = 40, X, = 10, n, = 40, and X, = 30. Complete parts (a) and (b) below. ... a. At the 0.05…
A:
Q: Exampie 13.15) Five coins are tossed 3,200 times and the number of heads appearing each time is…
A:
Q: Identify the correct statement concerning, r the correlation coefficie between X and Y and the…
A: Correlation is a measure that measures the strength or degree of relationship between two numerical…
Q: ACTIVITY. The following are the grades of 7 learners in Filipino and English. Compute the…
A: Given information: step 1: X Y 90 89 88 88 88 90 96 94 92 94 91 90 99 99 step…
Q: Sam is a competitive swimmer that competes in the 100 m freestyle and 100 m backstroke. High school…
A: For a specified type of swim, the z-score for Sam time may be defined as the standardized difference…
Q: 4. Ho: μ = 8.3 Ha: μ# 8.3 The sample mean is 9.2 and the sample size is 50. The population follows a…
A:
Q: Finding the sample size: Polls are to be conducted in two cities to determine the difference in the…
A: Given thatMargin of error (E) = 0.12Significance level (α) = 1 - 0.95 = 0.05
Q: Construct a confidence interval for P₁-P2 at the given level of confidence. x₁ = 34, n₁ = 229, x2 =…
A: For the given data Find confidence interval between the population proportions p1−p2
Q: Question: Which of the following is the equation of the regression line for your data on the number…
A: Solution:- from given information Number of server users = x Memory storage = y Regression Line:…
Q: Find the slope from the line of best fit y = 7-¾x₁ 31 - 0 -3 O MN
A:
Q: b. Calculate the Product Moment Correlation Coefficient, r, and describe the relationship shown on…
A: b. x y xy x2 y2 15 104 1560 225 10816 17 113 1921 289 12769 20 188 3760 400 353444 25 275…
Q: Use the given information to find the number of degrees of freedom, the critical value XL2 and XR2,…
A: Givenn=26s=0.28
Q: The sample means and variances of the observed data are needed to find the values in the sum of…
A: Given Information: No. of treatments=04Total no. of observations=74
Q: • Determine the number of possible samples with size 5. • Construct the distribution of the mean of…
A:
Q: Identify the equation of best fit of an exponential curve. O y = abx_ O y = a + bx Oy=a+bx+cx² O…
A: Third one is correct
Q: 26. IQ is normally distributed with a mean of 100 and a standard deviation of 15. a) Find the…
A:
Q: Fill in the expected frequencies.
A: here use given data table Outcome Observed Frequency Math/Science 318 Arts &…
Q: Twenty seven students were randomly selected from a known nornal population and the sample mean was…
A:
Q: August and September 2005, Hurricanes Ka stroyed, and of those that survived, many r due to the…
A: Given, For orleans parish : sample size (n1) = 369 x1 = 82 sample proportion (p1^) = x1/n1 = 82/369…
Q: 40,900 km. Can it be concluded that the new tyre is significantly better than the old one, using the…
A: A company manufacturing automobile tires finds that tyre-life is normally distributed with a mean…
Q: What would it be the coefficient of determination if the sums of squares due to regression (SSR) is…
A:
Q: standard deviations: Sample 1 Sample 2 17 12 n2 X2 X1 5.4 7.9 || S1 = 3.4 S2 4.8 variances, the a.…
A:
Q: Test whether the population average mpg is actually greater than 18 mpg using a 1% level of…
A:
Q: The mean daily production of a herd of cows is assumed to be normally distributed with a mean of 39…
A: Given that mean =39 ,s.d =9.2 p( 21.2 < x <22.6 ) =?
Q: A nutritionist wants to know the population proportion of Grade 1 learners who eat vegetables.…
A: 2) It is given that the sample size n is 1200 and the number of respondents who eat vegetables (x)…
Q: Which of the following predictions can be calculated using a geometric distribution?
A: here use basic of geometric distribution
Q: A simple random sample of 100 high school students who took the AP exam in statistics is taken from…
A: Solution:- from given information Null hypothesis H0:p1=0.4,p2=0.25,p3=0.23,p4=0.12Alternate…
Q: Determine whether the quantitative variable is discrete or continuous Numbers of words in a song
A: Determine whether the quantitative variable is discrete or continuous Numbers of words in a song
Q: Percent Under 21 Fatal Accidents per 1000 13 2.962 12 0.708 8 0.885 12 1.652 11 2.091 17 2.627 18…
A:
Q: Approximately, what is the '50-50' center of this distribution? (it is acceptable to give the…
A: In this case, we need to identify the correct option for the given statement.
Q: The medical researcher is comparing two treatments for lowering cholesterol: diet and meds. The…
A:
Q: 9.6 In order to compare the means of two populations, inde- NW pendent random samples of 400…
A: According to our guidelines, we can solve only three subparts. Please post the d part in separate…
Q: In an experiment to investigate the performance of four different brands of spark plugs intended for…
A: Sum of squares for Error: Mean squares Error=Sum of squaresdf 14671.13=Sum of…
Q: Two researchers conducted a study in which two groups of students were asked to answer 42 trivia…
A: Given that
Q: ntry (18 vears and older) was asked, "When you
A:
Q: An article in the Journal of Sound and Vibration (Vol. 151, 1991, pp. 383-394) described a study…
A:
Q: 5. A two-tailed test with 1% level of significance has t-computed value inoystlibont of -1.405 with…
A:
Q: What are the findings of the study?
A:
Q: 4. A feacher wants to know If there is a significant dissimllarlity In the performance task in…
A: Here We have to perform Null hypothesis and Alternate for given conditions
Q: R is a Normally distributed Random Variable such that r~ N(10,4). Which of the following is equal to…
A:
Q: A department in a small firm has 50 members. The distribution of the number of coffee breaks of the…
A: Given information: c f f*c 1 11 11 2 16 32 3 23 69 Total 50 112 Average:…
Q: Q18. If x~N(100, 25) and a random sample of x of size 16 is obtained. What is the standard deviation…
A:
Q: What does the Ljung Box Q test test for ?
A:
Q: 1. A bag contains some jelly beans - there are a total of 7 red jelly beans, 5 green jelly beans, 3…
A: Ans - There are a total 7 red jelly beans, 5 green jelly beans, 3 black jelly beans, 6…
Q: If n=210 and ˆpp^ (p-hat) =0.86, find the margin of error at a 90% confidence level Give your…
A:
Q: You wish to test the following claim (HaHa) at a significance level of α=0.001 Ho:p1=p2…
A:
Q: Determine whether each of the following experiments/situations involve a discrete or a continuous…
A: Discrete random variable : Its value is obtained by counting. Continuous random variable: Its value…

Step by step
Solved in 2 steps

- Which of the independent variables retains the strongest association with the number of children a respondent has when all other variables in the model are controlled? What is that association? Which has the weakest when other variables are controlled?A recent study claims that using music in a class enhances concentration and consequently helps students absorb more information. A researcherdecided to test this claim on a smaller group of randomly selected students from three different classes. Each classroom was provided with a different environment for students to study. Classroom A had constant music being played in the background, classroom B had variable music being played and classroom C was a regular class with no music playing. After one month, the researcher conducted a test for all the three groups and ranked their scores. What statistical test would be most appropriate for testing the research hypothesis? Explain your answer.Consider a regression analysis with n = 47 and three potential independent variables. Suppose that one of the independent variables has a correlation of 0.95 with the dependent variable. Does this imply that this independent variable will have a very large Student’s t statistic in the regression analysis with all three predictor variables?
- The researchers reported:" A 2x2 ANOVA revealed, first of all, a main effect for depletion, indicating that depleted individuals generated less ideas (M = 9.40, SD = 5.64) than non-depleted individuals (M = 12.44, SD = 7.34), F (1, 108) = 6.03, p = .016, n2 = .05. This effect was qualified by the expected interaction with [perseverance], F (1,108) = 4.52, p = .036, n2 = .05". What size are the effects for the main effect of depletion and for the interaction between depletion and perseverance, according to Cohen's conventions? a. These are small- to -medium effects b. These are non existent effects c. These are large effects d. We are unable to tell from from the n2 / r2 statisticsIn building an arena, steel bars with a mean ultimate tensile strength of 400 Megapascal (MPa) with a variance of 81 MPa were delivered by the manufactured. The project engineer tested 50 steel bars and found out that the mean ultimate tensile strength is 390 MPa. The decision for the extension of the contract with the manufacturer depends on the engineer. Test the hypothesis whether there is no significant difference between the two means using a two-tailed with a=0.01A pharmaceutical company has developed a drug that is expected to reduce hunger. To test the drug, three samples of rats are selected with n=9 in each sample. The first sample receives the drug every day. The second sample is given the drug once a week, and the third sample receives no drug at all (the control group). The dependent variables is the amount of food eaten by each rat over a 1-month period. These data are analyzed by an ANOVA, and the results are reported in the following summary table. Fill in all missing values in the table. (Hint: Start with the df column.) S.S. d.f. M.S. F Between 4.36 Within 3.71 TOTAL Use the =FDIST(∙) function in Excel or the pf(∙) function in R to locate the p-value for this ANOVA:p-value = Report answer accurate to at least 4 decimal places.If you use a significance level of α=.05, what would you conclude about these treatments? There is a significant difference between treatments These data do not provide…
- A researcher notes that there seems to be a difference in the prevalence of individuals who are medication adherent and have high levels of education along with a high health literacy and the prevalence of individuals who are not medication adherent and have low levels of education along with a low health literacy. Use the appropriate hypothesis to determine if education level and health literacy status are related (independent) at the 5%. Low Level of Education Low Medication Adherence High Medication Adherence Total Low Health Literacy 91 9 100 High Health Literacy 9 291 300 Total 100 300 400 High Level of Education Low Medication Adherence High Medication Adherence Total Low Health Literacy 96 4 100 High Health Literacy 4 296 300 Total 100 300 4003) Suppose you wish to perform model selection in multiple regression, but your statistical program can only fit individual multiple regression models, and does not do best subset selection, stepwise selection, or backward selection. Which of these three model selection procedures will be easiest to implement by fitting a series of individual multiple regression models? Briefly explain how you would implement one of these three model selection procedures by fitting individual multiple regression models.The records of a casualty insurance company show that, in the past, its clients have had a mean of 1.9 auto accidents per day with a variance of 0.0025 . The actuaries of the company claim that the variance of the number of accidents per day is no longer equal to 0.0025 . Suppose that we want to carry out a hypothesis test to see if there is support for the actuaries' claim. State the null hypothesis H0 and the alternative hypothesis H1 that we would use for this test. H0:H1: