
MATLAB: An Introduction with Applications
6th Edition
ISBN: 9781119256830
Author: Amos Gilat
Publisher: John Wiley & Sons Inc
expand_more
expand_more
format_list_bulleted
Topic Video
Question

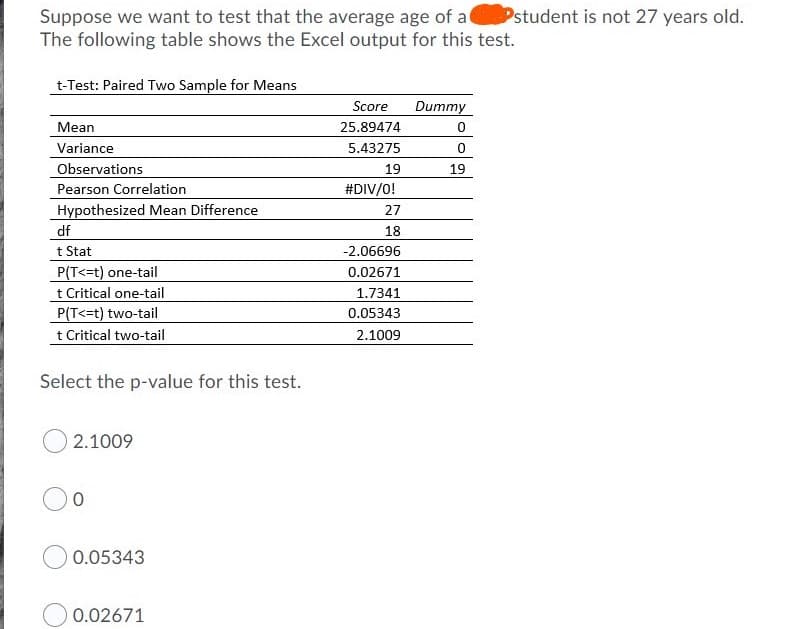
Transcribed Image Text:Suppose we want to test that the average age of a
The following table shows the Excel output for this test.
Pstudent is not 27 years old.
t-Test: Paired Two Sample for Means
Score
Dummy
Mean
25.89474
Variance
5.43275
Observations
Pearson Correlation
Hypothesized Mean Difference
19
19
#DIV/O!
27
df
18
t Stat
P(T<=t) one-tail
t Critical one-tail
P(T<=t) two-tail
t Critical two-tail
-2.06696
0.02671
1.7341
0.05343
2.1009
Select the p-value for this test.
2.1009
O 0.05343
0.02671
Expert Solution

This question has been solved!
Explore an expertly crafted, step-by-step solution for a thorough understanding of key concepts.
Step by stepSolved in 2 steps

Knowledge Booster
Learn more about
Need a deep-dive on the concept behind this application? Look no further. Learn more about this topic, statistics and related others by exploring similar questions and additional content below.Similar questions
- Please help! I need this to graduate, thank you so much.arrow_forwardCHOOSE ALL THAT APPLY: Which of the following are assumptions of ANOVA? Random sample Independent variable(s) are normally distributed Dependent variable is continuous Dependent variable is discrete Treatment variances are similar Treatment means are similar Dependent variables are normally distributedarrow_forwardhow to find the Variance for CBT and variance for BT,show step by step pleasearrow_forward
- what is homogeneity variance ? how does it influence students t-test and welch's t-test?arrow_forwardA homeless shelter program wants to know if receipt of job training program (yes, no) is related to program satisfaction (measured on a multi-item, Likert scale ). What type of statistical test should be used? Group of answer choices Independent t-test Dependent t-test ANOVA Correlation Analysis Chi Squarearrow_forwardA test statistic for one of the tests in this unit is given, along with information about degrees of freedom. Give the p-value and indicate whether the results are significant at the 5% level. An analysis of variance test with F-statistic 8.71 and df -numerator 3 and df -denominator = 17 Round your answer to four decimal places. p-valuearrow_forward
- Which of the following conclusions is correct for these test results? > bartlett.test(len~river, data=rivers) Bartlett test of homogeneity of variances data: len by river Bartlett's K-squared = 0.61394, df = 4, p-value = 0.5226 %3D Hint* the first line of code should tell you the type of test you are dealing with. There is NO significant difference in variances among the rivers. There is a significant difference in variances among the rivers. There is NO significant difference in means among the rivers.arrow_forwardDefine ADL or GLS: Bias versus variance?arrow_forwardCould please help interpret this SPSS output of a Independent sample t-test?arrow_forward
- Which would be the appropriate way to test differences in proportions for more than two samples? t-test if variance is unknown z-test paired t-test F-test for equality of variances cross-tabulation procedure to conduct a chi-square testarrow_forwardA researcher wants to measure average cardiovascular health of university students and compare those scores to the average scores in the general population. Assuming that population variance is known, what statistical test is most appropriate for this study? independent-samples t-test single-sample t-test z-test for sample mean related-samples t-testarrow_forwardWhich of the following correctly represents the coefficient of determination in terms of the variance that is an output from the analysis of variance table? Select one. explained variance + unexplained variance total variance unexplained variance total variance total variance explained variance total variancearrow_forward
arrow_back_ios
arrow_forward_ios
Recommended textbooks for you
- MATLAB: An Introduction with ApplicationsStatisticsISBN:9781119256830Author:Amos GilatPublisher:John Wiley & Sons IncProbability and Statistics for Engineering and th...StatisticsISBN:9781305251809Author:Jay L. DevorePublisher:Cengage LearningStatistics for The Behavioral Sciences (MindTap C...StatisticsISBN:9781305504912Author:Frederick J Gravetter, Larry B. WallnauPublisher:Cengage Learning
- Elementary Statistics: Picturing the World (7th E...StatisticsISBN:9780134683416Author:Ron Larson, Betsy FarberPublisher:PEARSONThe Basic Practice of StatisticsStatisticsISBN:9781319042578Author:David S. Moore, William I. Notz, Michael A. FlignerPublisher:W. H. FreemanIntroduction to the Practice of StatisticsStatisticsISBN:9781319013387Author:David S. Moore, George P. McCabe, Bruce A. CraigPublisher:W. H. Freeman

MATLAB: An Introduction with Applications
Statistics
ISBN:9781119256830
Author:Amos Gilat
Publisher:John Wiley & Sons Inc

Probability and Statistics for Engineering and th...
Statistics
ISBN:9781305251809
Author:Jay L. Devore
Publisher:Cengage Learning

Statistics for The Behavioral Sciences (MindTap C...
Statistics
ISBN:9781305504912
Author:Frederick J Gravetter, Larry B. Wallnau
Publisher:Cengage Learning

Elementary Statistics: Picturing the World (7th E...
Statistics
ISBN:9780134683416
Author:Ron Larson, Betsy Farber
Publisher:PEARSON

The Basic Practice of Statistics
Statistics
ISBN:9781319042578
Author:David S. Moore, William I. Notz, Michael A. Fligner
Publisher:W. H. Freeman

Introduction to the Practice of Statistics
Statistics
ISBN:9781319013387
Author:David S. Moore, George P. McCabe, Bruce A. Craig
Publisher:W. H. Freeman