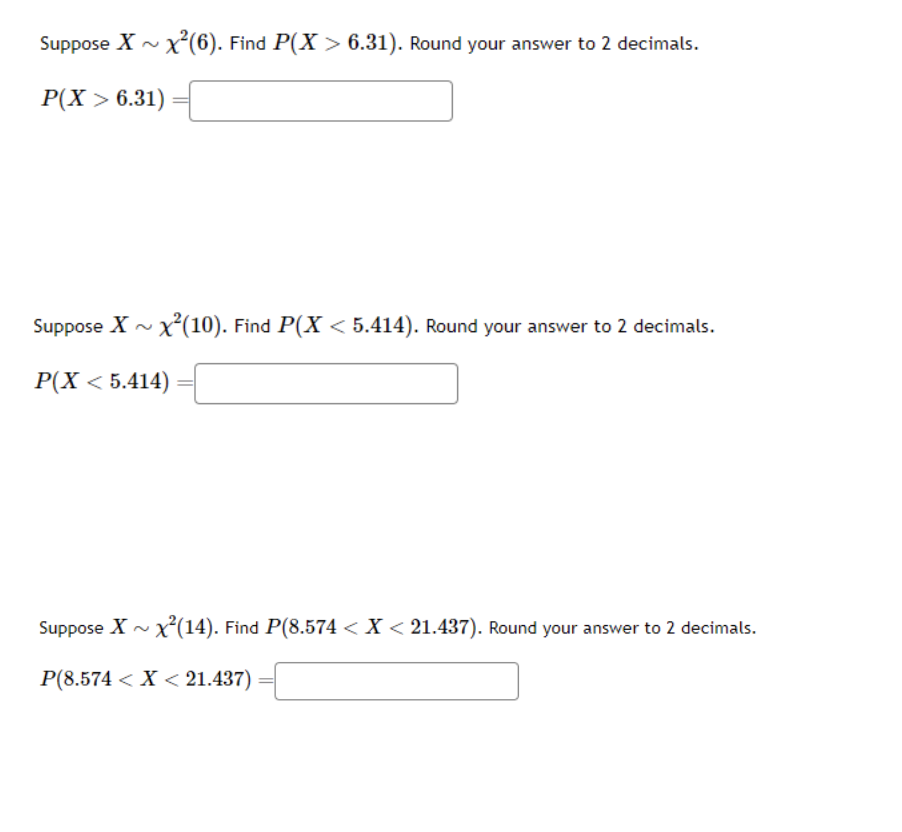
Suppose X~ x²(6). Find P(X> 6.31). Round your answer to 2 decimals. P(X> 6.31) Suppose X~ x²(10). Find P(X < 5.414). Round your answer to 2 decimals. P(X<5.414) Suppose X~ x²(14). Find P(8.574 < X < 21.437). Round your answer to 2 decimals. P(8.574 < X < 21.437)


Q: iffere Japan P/E Ratio 152 28 19 127 38 212 65 664 32 69 United States P/E Ratio 16 25 25 42 23 15…
A: Japan US P/E Ratio P/E Ratio 155 12 26 23 18 23 127 45 36 21 215 13 63 26 664 13…
Q: An IQ test is designed so that the mean is 100 and the standard deviation is 21 for the population…
A: given data, μ=100σ=21CI=0.95α=1-0.95=0.05E=7sample size =?
Q: d. Describe the distribution using the following characteristics: What is the shape of distribution?…
A: Given data: 3, 7, 6, 5, 5, 9, 6, 4, 6, 8, 10, 2, 7, 4, 9, 5, 6, 3, 8
Q: A simple random sample of 10 items resulted in a sample mean of 15. The population standard…
A: given data, n=10x¯=15σ=1
Q: Draw a vertical line through a normal distribution for each of the following z-score locations. Find…
A: A z-score is a measure that indicates how many standard deviations away, a data value lies, from the…
Q: Find the indicated IQ score. The graph to the right depicts IQ scores of adults, and those scores…
A: normal distribution μ=100σ=15the shaded area is p(Z>0.2525)value of IQ score for the given data.
Q: QUESTION 11 You are the head of fundraising for the Fayetteville Boys and Girls Club. You believe…
A: We have given that Mean(µ) = 85Sample size (n) = 84Sample mean (x̅) = 82Standard deviations (s) =…
Q: 6. You have sent out 1200 invitations to hear a speaker and must rent chairs for the guests that…
A: Given: Sample size(n)=1,200 Population proportion(p) =0.15
Q: a) Construct a 68.26% confidence interval for the mean of the population (in ounces). (Round your…
A: Let μ be the population mean weight of cans of coffee. Given that, Number of cans (n) = 169 Average…
Q: Let X be normally distributed with mean μ = 136 and standard deviation o = 34. a. Find P(X ≤ 100).…
A:
Q: 1. A random sample of size n = 9 yields the following observations: 75 78 77 76 74 75 74 76 75 Find…
A: 75, 74, 78, 77, 76, 75, 74, 76, 75
Q: What is a 95% confidence interval for the population mean taxi fare?
A: Here given , Suppose taxi fare from Logan Airport to downtown Boston is known to be normally…
Q: Assume that a randomly selected subject is given a bone density test. Those test scores are normally…
A: According to the given information, we have Z score = -1.54 (Right tailed)
Q: For the following set of scores 3 10 7 2 6 7 5 4 5 9 95 5 Find the Range, Number of Class and Class…
A: Given data: 3, 7, 6, 5, 5, 9, 6, 4, 6, 8, 10, 2, 7, 4, 9, 5, 6, 3, 8
Q: Assume that military aircraft use ejection seats designed for men weighing between 142.3 lb and 211…
A: Mean=M=175.5, Standard deviation=S=45.4
Q: Suppose you work for Fender Guitar Company and you are responsible for testing the integrity of a…
A: the average number of plucks is 6,106 with a standard deviation of 221.14 Sample size n =42
Q: In an experiment to assess the strength of the hunger drive in rats, 20 previously trained animals…
A: Sample size(n)=20sample Mean(x)=19.5standard deviation(σ)=5.5
Q: What requirements are necessary for a normal probability distribution to be a standard normal…
A: According to the given information in this question We need to identify the correct option
Q: The green turtle migrates across the Southern Atlantic in the winter, swimming great distances. A…
A: X~N( μ , ?) μ=2200 , ?=625 Z-score =( x - μ )/?
Q: Can you recheck and write the a and b portions.
A: (a) The probability that the maximum of X1 and X2 is k, for any k from 1 to n, is the same as the…
Q: Problem 6: Let X~ U(0,1), and suppose Y|X = x ~ N(x, x²). Find the joint distribution of U = 妾, V =…
A: We start by finding the joint probability density function (PDF) of U and V: Let f(x) be the PDF of…
Q: Pew research reported in 2013 that 15% of American adults do not use the internet or e-mail. They…
A: This question asks about the meaning of a margin of error reported by Pew Research in 2013 for a…
Q: The 95% confidence interval for the population slope was calculated as (0.751,0.947). Based on the…
A: We have given The confidence interval for slope is given to be (0.751, 0.947)
Q: explain how to iton. graphing calculator
A: The mean and standard deviation height of men are 67.3 in. and 3.2 in. respectively.
Q: The area under a normal curve corresponding to a certain characteristic of the normal random…
A: Introduction The normal curve is a bell shaped curve.
Q: to answer this que Two hundred students are enrolled in an Economics class. After the first…
A: Given Information: 200 students are enrolled in an Economics class. Sample size n=6 Scores: 67, 73,…
Q: Assume that females have pulse rates that are normally distributed with a mean of μ = 76.0 beats per…
A: given data, normal distributionμ=76σ=12.5we have to find out the given probabilities
Q: of a statistic is the probability that we obtain the statistic in repeated random samples. the…
A: It is given that the statement about to the sampling distribution. Here, need to find out the…
Q: The director of the rabies control section in a city health department wishes to draw a sample from…
A:
Q: In a telephone survey of 1,000 Americans randomly chosen by Rasmussen Reports, 40% say they have…
A: given data, n=1000p=0.40CI=0.95α=1-0.95=0.05margin of error=?
Q: Construct a 95% confidence interval for the true proportion. Sketch the graph of the situation.…
A: Let p be pop. prop. of online courses LBCC offered were taught by full-time faculty. Given that,…
Q: Refer to the accompanying data display that results from a sample of airport data speeds in Mbps.…
A: The formula for the point estimate for the population mean is, μ = x̄
Q: In a clinical experiment, people newly diagnosed with depression were randomly placed into two…
A: Given data: medication & counselling medication only poor outcome 24 42 good outcome…
Q: Computer-mediated communication (CMC) is a form of interaction that heavily involves technology…
A: Given: The data for two groups is given: CMC FTF No. of participants 24 24 sample mean 3.54…
Q: Write a brief but complete essay (minimum 200 words) in which you answer one the following…
A: Solution-: What is a null hypothesis H0? Describe its importance
Q: Head movement evaluations are important because disabled individuals may be able to operate…
A: The question is about hypo. testing Given : No. of subjects ( n ) = 14 Level of signif. ( α ) = 0.01…
Q: Annual starting salaries for college graduates with degrees in business administration are generally…
A: Here given 95% confidence interval, ($20,000 , $40,000) Required formula to solve this question :…
Q: a.What is the probability that the tickets are winners more than the average that George expected?…
A: George buys six lottery tickets for $2 each. In addition to the grand prize, there is a 20% chance…
Q: What is the excel formula? Can the solution for c be further explained? NO HANDWRITING PLEASE. I…
A: Given data : n = 8 df = n - 1 = 8 - 1 = 7 Alpha = 5% = 0.05
Q: Sarah has been offered a softball scholarship to two universities. She is trying to decide which…
A: We have to make comparison in two universities for their softball scholarship.
Q: 4 45 What is the total amount of vinegar, in milliliters, used by the 3 groups that used the most?…
A: Here given , During science class, groups measure out different volumes of vinegar. The line plot…
Q: In the figure below, vertical lines A and C indicates to the 2.5% tails of the null distribution,…
A: The graph is given with the various areas under cover 0-8. We need to determine the areas that count…
Q: (X, Y)~ Beta(01, 02, 03). Find the expected value and the variance of Y.
A: The joint probability density function of (X, Y) under the Beta distribution is given by: f(x,y) =…
Q: car salesperson has a 5% chance of landing a sale with a random customer on the lot. Suppose 10…
A: P = 5% =5/100 =0.05 ____________________________ n = 10 We know that Binomial distribution:…
Q: ormulate a null and alternative hypothesis for the registrar wants to know if the average encoding…
A: Let µ denotes hypothesized population mean.
Q: Assume that a randomly selected subject is given a bone density test. Those test scores are normally…
A: Let Z be the random variable from standard normal distribution with mean = 0 and standard deviation…
Q: E. Select two majors (for example marketing and management). Find the mean, standard deviation, and…
A: For Accounting: Mean: $53,040.00 Standard Deviation: $8,808.60Q1: $47,355.00 Q2 (Median): $52,320.00…
Q: 4. Sixteen-ounce boxes of shredded wheat cereal packed automatically by machine are sometimes over-…
A: Here given, Sixteen-ounce boxes of shredded wheat cereal packed automatically by machine are…
Q: . Cereal. The amount of cereal that can be poured into a small bowl varies with a mean of 1.5 ounces…
A: Note: Thankyou! for the question. As you have mentioned we will be providing answers for parts d, e…
Q: Find the value of the standard score, z, and determine whether to reject the null hypothesis at a…
A: given data claim:μ > 4.5n = 121x¯ = 7.5σ = 2.5α = 0.05


Trending now
This is a popular solution!

Step by step
Solved in 4 steps with 2 images

- For example, for student ID s1243657, the 4th digital of s1243657 is “3”, therefore variable “A” is “Use interactive activities”; the 5th digital of s1243657 is “6”, therefore variable “B” is “Give a lot of assignments”; the 6th digital of s1243657 is “5”, therefore variable “C” is “Good communication skills. Take student id S12042516 as an example. With the data collected, Dr Tian ran a test to see if there were significant relationships between A, B, C and satisfaction toward e-learning. i ) Suggest the test that should be used and explain your reason. State the independent and dependent variables, underlying null and alternative hypotheses.Recent studies have shown that about 39.4% of American adults fit the medical definition of being obese. A large medical clinic would like to estimate what percentage of their patients are obese, so they take a random sample of 600 patients and find that 204 are obese. Suppose that in truth, the same percentage holds for the patients of the medical clinic as for the general population, 39.4%. Give a numerical value for each of the following. (a) the population proportion, p, of obese patients in the medical clinic p = (b) the proportion of obese patients, p̂, for the sample of 600 patients p̂ = (c) the standard error, s.e., of p̂ (Round your answer to four decimal places.) s.e.(p̂) = (d) the mean of the sampling distribution of p̂ (e) the standard deviation, s.d., of the sampling distribution of p̂ (Round your answer to four decimal places.)To determine the number of in a lake , a conservationist catches 450 trout's , tags them, and releases them. Later 88 are caught, and it is found that 45 of them are tagged. Assuming that the proportion of tagged in the second sample was the same as the proportion of tagged in the total population, estimate the number of in the lake.
- A farmer estimates that 4% of the 1,400 fruit trees on his farm will fail to produce fruit, with a margin of error of 2.5%. Based on this information, which statements are true? Select all that apply. Because 4% of the fruit trees will fail to produce fruit, the farmer should calculate 4% of 1,400. Then, he should subtract 2.5% of that number to find the low end of the range. He should also add 2.5% to that number to find the high end of the range trees that fail to produce fruit. Between 53 and 57 trees can be expected to fail to produce fruit. Because there is a margin of error of 2.5%, the farmer should calculate 2.5% of 1,400 to find the high end of the range of trees that fail to produce fruit. The lowest number of trees that fail to produce fruit is simply 0. Between 0 and 35 trees can be expected to fail to produce fruit. Because there is a margin of error of 2.5%, between 1.5% and 6.5%6.5% of the fruit trees will fail to produce fruit. The farmer should calculate 1.5%…Suppose the proportion of all college students who have used marijuana in the past 6 months is p = 0.40. In a class of 150 students that are representative of all college students, would it be unusual for the proportion who have used marijuana in the past 6 months to be less than 0.33?A medical researcher says that less than 86% of adults in a certain country think that healthy children should be required to be vaccinated. In a random sample of 300 adults in that country, 84% think that healthy children should be required to be vaccinated. At α=0.05, is there enough evidence to support the researcher's claim? Complete parts (a) through (e) below. (a) Identify the claim and state H0 and Ha. Identify the claim in this scenario. Select the correct choice below and fill in the answer box to complete your choice. (Type an integer or a decimal. Do not round.) A. Less than 8686% of adults in the country think that healthy children should be required to be vaccinated. B. The percentage of adults in the country who think that healthy children should be required to be vaccinated is not nothing%. C. nothing% of adults in the country think that healthy children should be required to be vaccinated. D. More than nothing%…
- The television show Lett3rs has been successful for many years. That show recently had a share of 19, which means, that among the TV sets in use, 19% were tuned to Lett3rs. An advertiser wants to verify that 19% share value by conducting its own survey, and a pilot survey begins with 10 households have TV sets in use at the time of a Lett3rs broadcast. If at most one household is tuned to Lett3rs, does it appear that the 19% share value is wrong? (Hint: Is the occurrence of at most one household tuned to Lett3rs unusual?) A. no, it is not wrongB. yes, it is wrongA city official claims that the proportion of all commuters who are in favor of an expandedpublic transportation system is 50%. A newspaper conducts a survey to determine whetherthis proportion is different from 50%. Out of 225 randomly chosen commuters, the surveyfinds that 99 of them reply yes when asked if they support an expanded public transportationsystem. Test the official’s claim atα= 0.05.Among college students, the proportion p who say they’re interested in their congressional district’s election results has traditionally been 75%. After a series of debates on campuses, a political scientist claims that the proportion of college students who say they’re interested in their district’s election results is more than 75%. A poll is commissioned, and 207 out of a random sample of 255 college students say they’re interested in their district’s election results. Is there enough evidence to support the political scientist's claim at the 0.05 level of significance?Perform a one-tailed test. Then complete the parts below. Carry your intermediate computations to three or more decimal places. A. State the null hypothesis H0 and the alternative hypothesis H1 B. Would (Z) (t) (Chi-square) or (F) be the best statistic to use? C. Find the value of the test statistic. (Round to three or more decimal places.) D. Find the critical value. (Round to three or more decimal places.) E. Is…
- Among college students, the proportion p who say they’re interested in their congressional district’s election results has traditionally been 65% . After a series of debates on campuses, a political scientist claims that the proportion of college students who say they’re interested in their district’s election results is more than 65% . A poll is commissioned, and 194 out of a random sample of 270 college students say they’re interested in their district’s election results. Is there enough evidence to support the political scientist's claim at the 0.05 level of significance? Perform a one-tailed test. Then complete the parts below. Carry your intermediate computations to three or more decimal places. (If necessary, consult a list of formulas.) (a) State the null hypothesis H0 and the alternative hypothesis H1 . H0: H1: (b) Determine the type of test statistic to use. ▼(Choose one) (c) Find the value of the test statistic.…Among college students, the proportion p who say they’re interested in their congressional district’s election results has traditionally been 65%. After a series of debates on campuses, a political scientist claims that the proportion of college students who say they’re interested in their district’s election results is more than 65%. A poll is commissioned, and 180 out of a random sample of 250 college students say they’re interested in their district’s election results. Is there enough evidence to support the political scientist's claim at the 0.05 level of significance? Perform a one-tailed test. Then complete the parts below.Carry your intermediate computations to three or more decimal places. a.) State the null hypothesis H0 and the alternative hypothesis H1. b.) Determine the type of test statistic to use (Z, t (with t, degrees of freedom is needed), Chi-Square, or F). c.) Find the value of the test statistic. (Round to three or more decimal places.) d.) Find the p-value. (Round…Suppose that there are 4 deaths due to stomach can- cer among workers in a tire plant from 1/1/64 to 12/31/83, while 2.5 are expected based on U.S. mortality rates. Provide a 95% CI for the expected number of deaths from stomach cancer over 20 years among the tire workers. Is the number of cases of stomach cancer excessive?


