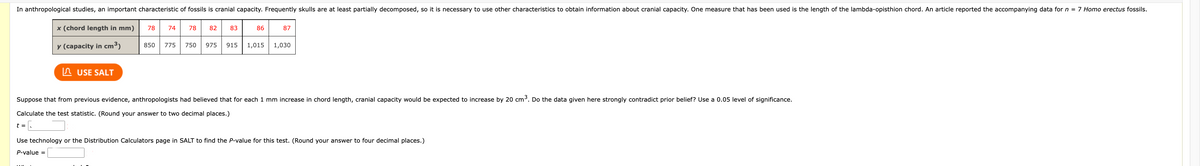
t and pvalue please


Q: Suppose a random sample of size 30 is selected from a population with 6 = 10. Find the value of the…
A:
Q: Ten large industrial corporations yield the following data: Company | Sales (in Millions $) |…
A: Since you have posted a question with multiple sub-parts, we will solve first three subparts for…
Q: (a) Estimate the slope of the population regression line. Estimate y intercept of the population…
A: From given data: n=20,∑x=50,∑y=16604,∑x2=150, ∑y2=14194235, ∑xy=44195,
Q: Listed below are systolic blood pressure measurements (in mm Hg) obtained from the same woman. Find…
A: Given data Right arm 102 101 94 80 79 left arm 177 172…
Q: A graduate student believes that people consider faces with more contrast between eye color and skin…
A: The level of significance is 0.01.
Q: The district sales manager for a major supermarket chain is studying sales. He believes sales depend…
A:
Q: Determine whether r is positive, negative, or zero for each of the following data sets. Q Ⓡ ∞∞o (a)…
A:
Q: In trying to determine the relationship between consumer sentiment on annualized GDP growth, you…
A: It is given that the GDP growth rate is a dependent variable (Y) and consumer sentiment (X) is the…
Q: Question: Suppose that aproduct is produced in the three facborks X, Y SZ, it is Krucion that…
A: Given information: Let the probability that product is produced in company Y = k…
Q: A simple random sample of 1,000 people is taken to estimate the percentage of Democrats in a large…
A: Given Information: Sample size n=1000 people Out of which x=543 people are democrats. The sample…
Q: Consider the following annual sales data for 2001-2008: Year Sales 2001 2…
A: Consider the Anal sale data Year Sale 2001 2 2002 4 2003 10 2004 8 2005 14 2006 18…
Q: In a survey of 1000 adult Americans, 45.4% indicated that they were somewhat interested or very…
A:
Q: Issuer Rating Yield Spread (bps) Treasury Benchmark Corporation A Triple A 7.87 50 10…
A: Given Data Issuer Rating Yield Spread Treasury Benchmark Corporation A Triple A 7.87 50 10…
Q: Correlation coefficient Exercise 4.7 Consider n observations for which yi = a + bxi, b>0, holds.…
A:
Q: A sample mean, sample standard deviation, and sample size are given. Use the one-mean t-test to…
A:
Q: Below is a summary table from an analysis of variance in which means from three groups are compared.…
A: Given that: Sources SS df MS F Between-groups 29.78 Within-groups 2.36 Total…
Q: For each problem, select the best response. (a) Suppose you collect a SRS of size n from a…
A:
Q: Question 2: You currently have $21,000 saved in your bank account. You have decided to use $6,300…
A: Given data you currently have $21000 saved in your bank account you have decided to use $6300
Q: If X=117, o=24, and n = 30, construct a 99% confidence interval estimate of the population mean, μ.…
A: GivenMean(x)=117standard deviation(σ)=24sample size(n)=30Confidence level=99%
Q: A study was done to look at the relationship between number of lovers college students have had in…
A: “Since you have posted a question with multiple sub-parts, we will solve the first three sub-parts…
Q: Show that the normal distribution has a relative maximum at x = p. inflection points at x = μ-o and…
A: Since you have asked multiple questions, we will solve the first question for you. If you want any…
Q: A clinical trial was conducted to test the effectiveness of a drug for treating insomnia in older…
A: Given data mean=98.7 standard deviation=20.9
Q: Javier
A:
Q: A car company conducts crash tests of its new airbag system to evaluate its safety. One hundred…
A: μ = 2 inches n = 100 X = 2.1 inches σ = 0.2 inches Formula Used: Test-statistic Z = X-μσn
Q: 9.32 A manufacturing company produces steel housings for electrical equipment. The main component…
A: Solution: Given information: n=49 Sample size Claim: The mean width of the trough is different from…
Q: The following data set shows the entrance exam score (Verbal GMAT) for each of eight MBA students…
A:
Q: The table below shows the total annual precipitation for San Diego, California. Year 1994 1995 1996…
A: Given: 9.4 17 7.3 7 16.1 5.4 6.9 8.5 4.2 9.2
Q: =) A random sample of 2 nute and a standard devi terval for the population ou may use the table give
A: Given: Sample size (n) = 25 Sample mean x¯=72 Sample standard deviation (s) = 13
Q: 100 persons are surveyed about their smoking habits. The results are shown below: Do you smoke? Male…
A: We have given that 100 person are surveyed about their smoking habits and given a table for smoker…
Q: A quality control program is being developed for computer hard-drivers. The mean fraction defective…
A: Given information: The mean fraction defective in the samples in the past has been 3%. Let,…
Q: A regression model involving 4 independent variables and a sample of 15 periods resulted in the…
A:
Q: Boran Stockbrokers, Inc., selects four stocks for the purpose of developing its own index of stock…
A: Given that: Stock Industry Year 1 Quantity Price per Share (s) Year 1 Base January Year 3…
Q: The 2004 General Social Survey asked a random sample of 977 adult Americans how often they feel…
A: Given datan=977x=304
Q: Do bonds reduce the overall risk of an investment portfolio? Let x be a random variable representing…
A: Measures of Central Tendency: A summary measure called a measure of central tendency, also known as…
Q: In a random sample of 41 professional actors, it was found that 15 were extroverts. Find a 99%…
A:
Q: A quality index summarizes different features of a product by means of a score. Different experts…
A:
Q: 9.51 The population mean waiting time to check out of a supermarket has been 4 minutes. Recently, in…
A: Given that We have to conduct hypothesis testing for the claim that population mean wait time is…
Q: The type of probabilistic sampling where the researcher take the list or map and give each unit a…
A: In systematic random sampling, each unit are given a number. The first sample is taken at random.…
Q: After running a regression on 60 monthly observations of a fund's returns on the returns of a stock…
A: Given: Sample size, n=60 Estimate of slope coefficient, β^1=1.18 Standard error is, seβ^1=0.39
Q: Crester! The Mapiables X and I are connected by the equations axt by to zo. You have to show that…
A: Solution is given: There two questions in the frist image and one more question in the second image.…
Q: A certain drug is used to treat asthma. In a clinical trial of the drug, 22 of 263 treated subjects…
A: Note: According to Bartleby guidelines expert solve only one question and maximum 3 subpart of the…
Q: Test the claim that the proportion of men who own cats is smaller than the proportion of women who…
A:
Q: For 7 and 8, use the following information: We run a regression test, regressing test score on hours…
A: “Since you have posted multiple questions, we will solve first question for you. To get the…
Q: In the following data set, what is the percentile value of a score of 3? (Hint: Don’t forget to…
A: Followings are the Explanation of the question
Q: If, in a sample of n = 16 selected from a normal population, X = 56 and S=20, how many degrees of…
A:
Q: Find the amount in the account at the end of 1 year. $
A:
Q: What is the test statistic?(3 decimal places) What is the critical value(s)?(3 decimal places)…
A: The given correlation coefficient is 0.868.
Q: The following information is collected from students upon exiting the campus bookstore during the…
A: Numerical variable are countable and quantitative in nature. For ex: number of students in a class…
Q: The polynomial regression model of degreer is given by Y₁ =B₁ + B₁X₁ + B₂X² + ... + B₂X[ + +Uj.…
A: When a polynomial equation is used to fit on the data with a curvilinear relationship between the…
Q: Use the table and the given regression equation to answer parts (a)-(e). 3 2 y=4-4x -8 X y 1 O No…
A: “Since you have posted a question with multiple sub-parts, we will solve first three sub-parts for…
t and pvalue please

Step by step
Solved in 3 steps

- Kaitlyn measures the upload speed in megabits per second of her home broadband internet connection during peak hours and off-peak hours. The results are provided in the accompanying table. Peak Off-Peak 5.83 5.14 6.05 6.80 7.14 6.98 3.54 5.77 5.45 7.27 5.90 6.62 5.81 6.19 4.82 6.08 6.37 6.59 4.65 5.58 5.30 7.41 6.48 6.26 5.96 6.37 5.79 6.31 6.84 6.55 5.06 4.95 5.61 7.03 6.45 6.77 Examine the results of Kaitlyn's test to determine the statements that compare the medians and interquartile ranges of the data sets to each other in terms of this situation. Select the two correct answers. The median upload speed during peak hours is 5.905 megabits per second, which is less than the median upload speed during off-peak hours, 7.005 megabits per second. The upload speeds during peak hours are slower on average compared to off-peak times. The median upload speed during peak hours is 6.37 megabits per second, which is greater than the median upload speed during…A poll found that 15% of adults do not work at all while on summer vacation. In a random sample of 8 adults, let x represent the number who do not work during summer vacation. Complete parts a through e.Dyslexia refers to a specific reading disability that affects 10% to 15% of the general population. A dyslexic child is defined as a child of normal or above-normal intelligence with no known organic behavioural disorders who, despite normal schooling, shows a reading lag of at least two years. A researcher proposed that dyslexia was the result of a complex visual deficit that could be immediately corrected by simply putting a blue plastic overlay on the reading material. To test this, 100 dyslexic children were randomly assigned to one of two groups, one of which read from pages with a clear plastic overlay and the other of which read from pages with a blue plastic overlay. The dependent variable was percentage correct on a multiple-choice reading comprehension test. a) Is this an observational study or an experiment? Explain your choice. b) Why did the researcher use a clear overlay as one of the treatment groups instead of just having the children read the passage without an…
- Dyslexia refers to a specific reading disability that affects 10% to 15% of the general population. A dyslexic child is defined as a child of normal or above-normal intelligence with no known organic behavioural disorders who, despite normal schooling, shows a reading lag of at least two years. A researcher proposed that dyslexia was the result of a complex visual deficit that could be immediately corrected by simply putting a blue plastic overlay on the reading material. To test this, 100 dyslexic children were randomly assigned to one of two groups, one of which read from pages with a clear plastic overlay and the other of which read from pages with a blue plastic overlay. The dependent variable was percentage correct on a multiple-choice reading comprehension test. What assumptions for the hypothesis test would need to be conducted for a one sample t test? Which data on spss would i need to look at for the assumptions?Given screenshot is the outcome of an exercise program. Use Chi-square analysis to understand Male Weight Loss by joining the Exercise Program. Assume the Critical Value of 3.84.A study is made for a particular allergy medication in order to determine the length of relief it provides Y (in hours) in relation to the dosage of medication X (in mg). For this reason, ten patients were given different doses of the medication and were asked to report back when the medication seemed to wear off. Patient #1 #2 #3 #4 #5 #6 #7 #8 #9 #10 Dosage (x) Relief Hours (y) 3 3.5 4 5 6 6.5 7 8 8.5 9 9.1 5.5 12.3 9.2 14.2 16.8 22.0 18.3 24.5 22.7 (i) Draw a scatter diagram. (ii) Calculate the product moment correlation coefficient and comment on your answer. (iii) Construct the least squares regression line.
- The article “Effect of Varying Solids Concentration and Organic Loading on the Performance of Temperature Phased Anaerobic Digestion Process” (S. Vandenburgh and T. Ellis, Water Environment Research, 2002:142–148) discusses experiments to determine the effect of the solids concentration on the performance of treatment methods for wastewater sludge. In the first experiment, the concentration of solids (in g/L) was 43.94 ± 1.18. In the second experiment, which was independent of the first, the concentration was 48.66 ± 1.76. Estimate the difference in the concentration between the two experiments, and find the uncertainty in the estimate.Researchers interested in lead exposure due to car exhaust sampled the blood of 52 police officers subjected to constant inhalation of automobile exhaust fumes while working traffic enforcement in a primarily urban environment. The blood samples of these officers had an average lead concentration of 124.32 µg/l and a SD of 37.74 µg/l; a previous study of individuals from a nearby suburb, with no history of exposure, found an average blood level concentration of 35 µg/l. Based on your preceding result, without performing a calculation, would a 99% confidence interval for the average blood concentration level of police officers contain 35 µg/l? Based on your preceding result, without performing a calculation, would a 99% confidence interval for this difference contain 0? Explain why or why not.calculate d and e with good working outs ...
- Listed below are amounts of strontium-90 (in millibecquerels, or mBq) in a simple random sample of baby teeth obtained from residents in a region born after 1979. Use the given data to construct a boxplot and identify the 5-number summary. a. The 5-number summary is all in mBq. (Use ascending order. Type integers or decimals. Do not round.) b. Which boxplot below represents the data?A study of the relationship between age and various visual functions (such as acuity and depth perception) reported the following observations on the area of scleral lamina (mm2) from human optic nerve heads: 2.84 2.63 2.76 3.75 2.28 2.64 3.94 4.11 3.80 4.27 3.49 4.51 2.40 3.59 2.72 3.55 3.02 (a) Calculate Σxi and Σxi2. Σxi = ? mm2 Σxi2 = ? mm4 (b) Use the values calculated in part (a) to compute the sample variance s2 and then the sample standard deviation s. (Round your answers to four decimal places.) s2 = ? mm4 s = ? mm2Is the magnitude of an earthquake related to the depth below the surface at which the quake occurs? Let x be the magnitude of an earthquake (on the Richter scale), and let y be the depth (in kilometers) of the quake below the surface at the epicenter. x 2.8 3.9 3.3 4.5 2.6 3.2 3.4y 4.7 9.6 11.2 10.0 7.9 3.9 5.5(a) Make a scatter diagram of the data.Flash Player version 10 or higher is required for this question. You can get Flash Player free from Adobe's website. Then visualize the line you think best fits the data. (b) Use a calculator to verify that Σx = 23.7, Σx2 = 82.75, Σy = 52.8, Σy2 = 447.56 and Σxy = 184.28. Compute r. (Round to 3 decimal places.) As x increases, does the value of r imply that y should tend to increase or decrease? Explain your answer.Given our value of r, we can not draw any conclusions for the behavior of y as x increases.Given our value of r, y should tend to remain constant as x increases. Given our value of r, y should tend to decrease as x increases.Given…
