Table 1 A problem with a phone line that prevents a customer from receiving or making calls is upsetting to both the customer and the telecommunications company. The file "Phone" contains samples of 20 problems reported to two different offices of a telecommunications company and the time to clear these problems (in minutes) from the customers' lines: Central Office I Time to Clear Problems (minutes) 1.48 1.75 0.78 2.85 0.52 1.60 4.15 3.97 1.48 3.10 1.02 0.53 0.93 1.60 0.80 1.05 6.32 3.93 5.45 0.97 Central Office II Time to Clear Problems (minutes) 7.55 3.75 0.10 1.10 0.60 0.52 3.30 2.10 0.58 4.02 3.75 0.65 1.92 0.60 1.53 4.23 0.08 1.48 1.65 0.72 Assuming that the population variances from both offices are equal, is there evidence that the mean waiting time at Central Office I is different with that at Central Office II? You may download file "Phone".
Table 1 A problem with a phone line that prevents a customer from receiving or making calls is upsetting to both the customer and the telecommunications company. The file "Phone" contains samples of 20 problems reported to two different offices of a telecommunications company and the time to clear these problems (in minutes) from the customers' lines: Central Office I Time to Clear Problems (minutes) 1.48 1.75 0.78 2.85 0.52 1.60 4.15 3.97 1.48 3.10 1.02 0.53 0.93 1.60 0.80 1.05 6.32 3.93 5.45 0.97 Central Office II Time to Clear Problems (minutes) 7.55 3.75 0.10 1.10 0.60 0.52 3.30 2.10 0.58 4.02 3.75 0.65 1.92 0.60 1.53 4.23 0.08 1.48 1.65 0.72 Assuming that the population variances from both offices are equal, is there evidence that the mean waiting time at Central Office I is different with that at Central Office II? You may download file "Phone".

Glencoe Algebra 1, Student Edition, 9780079039897, 0079039898, 2018
18th Edition
ISBN:9780079039897
Author:Carter
Publisher:Carter
Chapter10: Statistics
Section10.6: Summarizing Categorical Data
Problem 27PPS

Related questions
Question
Referring to Table 1, at the α = 0.01 level, the correct critical value(s) is (are)
Question 26 options:
|
|
|
||
|
|
|
||
|
|
|
||
|
|
|
Referring to Table 1, the correct test statistic is
Question 27 options:
|
|
|
||
|
|
|
||
|
|
|
||
|
|
|
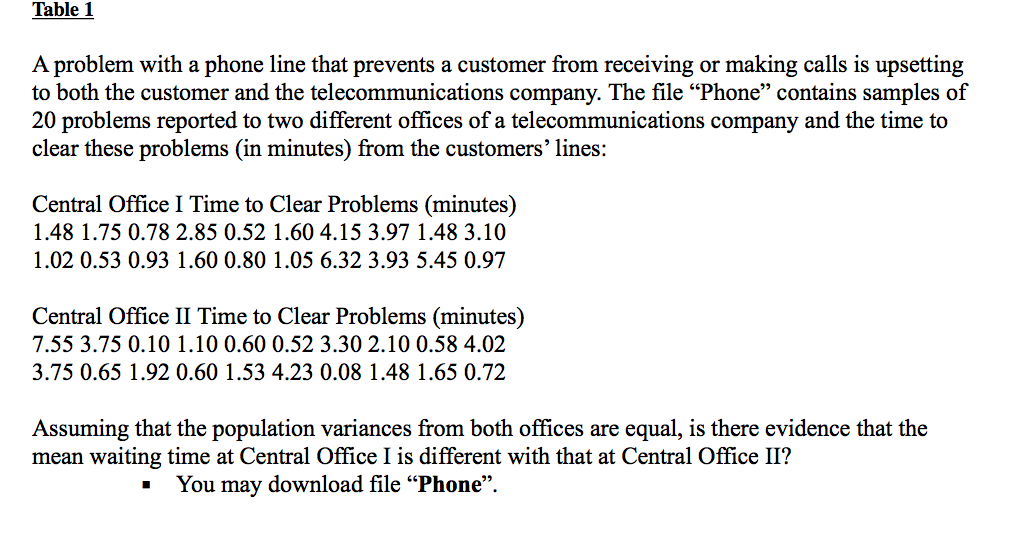
Transcribed Image Text:Table 1
A problem with a phone line that prevents a customer from receiving or making calls is upsetting
to both the customer and the telecommunications company. The file "Phone" contains samples of
20 problems reported to two different offices of a telecommunications company and the time to
clear these problems (in minutes) from the customers' lines:
Central Office I Time to Clear Problems (minutes)
1.48 1.75 0.78 2.85 0.52 1.60 4.15 3.97 1.48 3.10
1.02 0.53 0.93 1.60 0.80 1.05 6.32 3.93 5.45 0.97
Central Office II Time to Clear Problems (minutes)
7.55 3.75 0.10 1.10 0.60 0.52 3.30 2.10 0.58 4.02
3.75 0.65 1.92 0.60 1.53 4.23 0.08 1.48 1.65 0.72
Assuming that the population variances from both offices are equal, is there evidence that the
mean waiting time at Central Office I is different with that at Central Office II?
You may download file "Phone".
Expert Solution
This question has been solved!
Explore an expertly crafted, step-by-step solution for a thorough understanding of key concepts.

Step by step
Solved in 4 steps with 4 images

Recommended textbooks for you
Glencoe Algebra 1, Student Edition, 9780079039897…
Algebra
ISBN:
9780079039897
Author:
Carter
Publisher:
McGraw Hill
Glencoe Algebra 1, Student Edition, 9780079039897…
Algebra
ISBN:
9780079039897
Author:
Carter
Publisher:
McGraw Hill