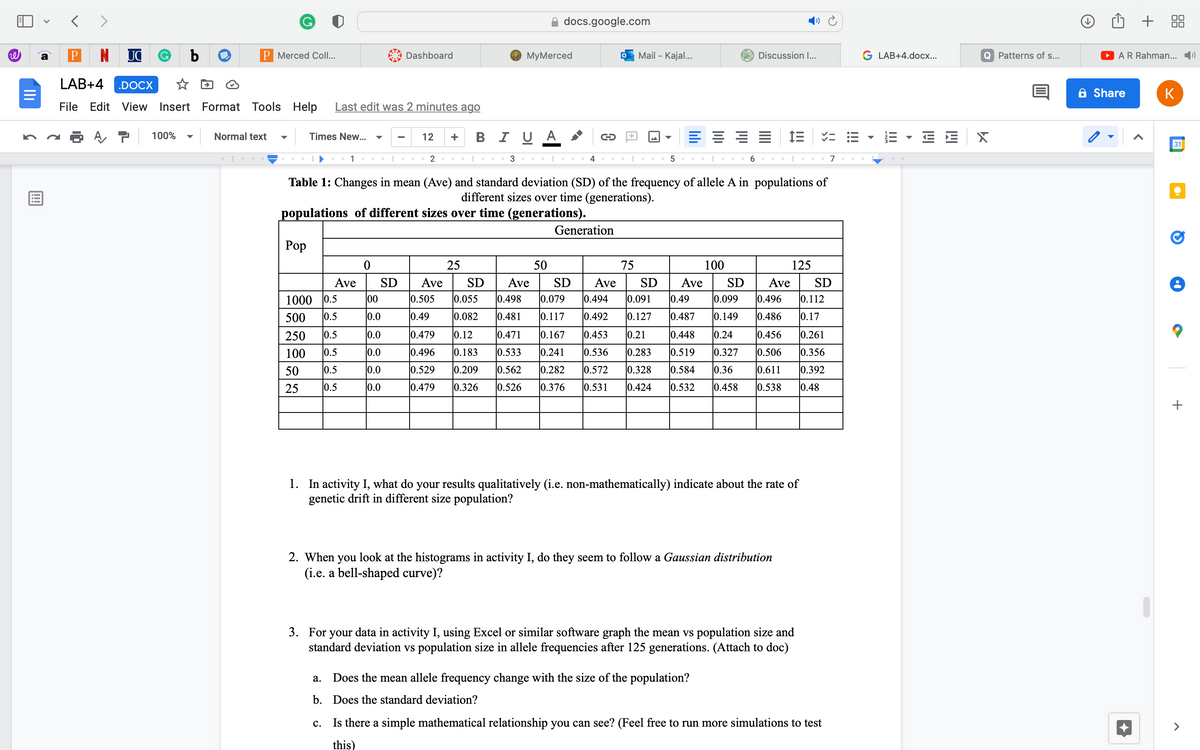
Table 1: Changes in mean (Ave) and standard deviation (SD) of the frequency of allele A in populations of different sizes over time (generations). populations of different sizes over time (generations). Generation Pop 25 50 75 100 125 Ave SD Ave SD Ave SD Ave SD Ave SD Ave SD 1000 0.5 00 0.505 0.055 0.498 0.079 0.494 0.091 0.49 0.099 0.496 0.112 500 0.5 0.0 0.49 0.082 0.481 0.117 0.492 0.127 0.487 0.149 0.486 0.17 0.453 0.536 250 0.5 0.0 0.479 0.12 0.471 0.167 0.21 0.448 0.24 0.456 0.261 100 0.5 0.0 0.496 0.183 0.533 0.241 0.283 0.519 0.327 0.506 0.356 50 0.5 0.0 0.529 0.209 0.562 0.282 0.572 0.328 0.584 0.36 0.611 0.392 25 0.5 0.0 0.479 0.326 0.526 0.376 0.531 0.424 0.532 0.458 0.538 0.48 1. In activity I, what do your results qualitatively (i.e. non-mathematically) indicate about the rate of genetic drift in different size population?


Gene Flow
Gene flow, also known as gene migration, is the introduction of genetic material from a particular population to another population of the same species through interbreeding. For example, a bee facilitates its reproductive process by carrying pollen from one flower to another. The flow alters the composition of the gene pool of the receiving population. It introduces new alleles within the population and helps increase variability. This exchange of genetic material occurs through reproduction and brings about new combinations of traits into the population. Where human beings are concerned, actual migration of populations, whether voluntary or forced, brings about gene flow.
Population Biology
Population biology is the study of patterns in organism populations, specifically the growth and management of population size, population genetics, the evolution of life history, species interactions, and demography.
Speciation
The process of speciation involves the formation of new species during evolution. The new species evolve in such a way that both new and old species are not able to interbreed. Thus, speciation occurs when few members of one species get separated from the main species due to geographical, mechanical, or reproductive isolation. These separated members develop new traits that make them different from the main species. In other words, speciation could be defined as the absence of gene flow between two populations that become new species.
Allele Fixation
A gene is a unit of heredity and contains both physical and functional information that shapes an individual. Genes are made up of DNA (deoxyribonucleic acid), which carry genetic information from one generation to another, from one set of parents to their offspring, and so on. Every cell in a human body, or any living organism, has the same DNA, which implies that every cell in an individual’s body has all the information it needs to build and sustain the body!


Trending now
This is a popular solution!

Step by step
Solved in 2 steps with 1 images


