Table 16-3 The following table shows the output produced by each of the top eight firms in four industries as well as the total industry output for those industries. Firm 1 2 3 4 5 6 7 8 Total Industry A 50,000 47,000 43,000 38,000 32,000 25,000 17,000 8,000 270,000 Industry B Industry C 18,000 37,000 40,000 17,750 36,500 39,000 17,250 35,500 37,000 16,500 34,000 34,000 15,500 32,000 30,000 14,250 29,500 25,000 12,750 26,500 19,000 11,000 23,000 12,000 130,000 300,000 250,000 approximately 46% approximately 54% approximately 57% approximately 61% Industry D Refer to Table 16-3. What is the concentration ratio for Industry B?
Table 16-3 The following table shows the output produced by each of the top eight firms in four industries as well as the total industry output for those industries. Firm 1 2 3 4 5 6 7 8 Total Industry A 50,000 47,000 43,000 38,000 32,000 25,000 17,000 8,000 270,000 Industry B Industry C 18,000 37,000 40,000 17,750 36,500 39,000 17,250 35,500 37,000 16,500 34,000 34,000 15,500 32,000 30,000 14,250 29,500 25,000 12,750 26,500 19,000 11,000 23,000 12,000 130,000 300,000 250,000 approximately 46% approximately 54% approximately 57% approximately 61% Industry D Refer to Table 16-3. What is the concentration ratio for Industry B?

Chapter15: Oligopoly And Strategic Behavior
Section: Chapter Questions
Problem 12P

Related questions
Question
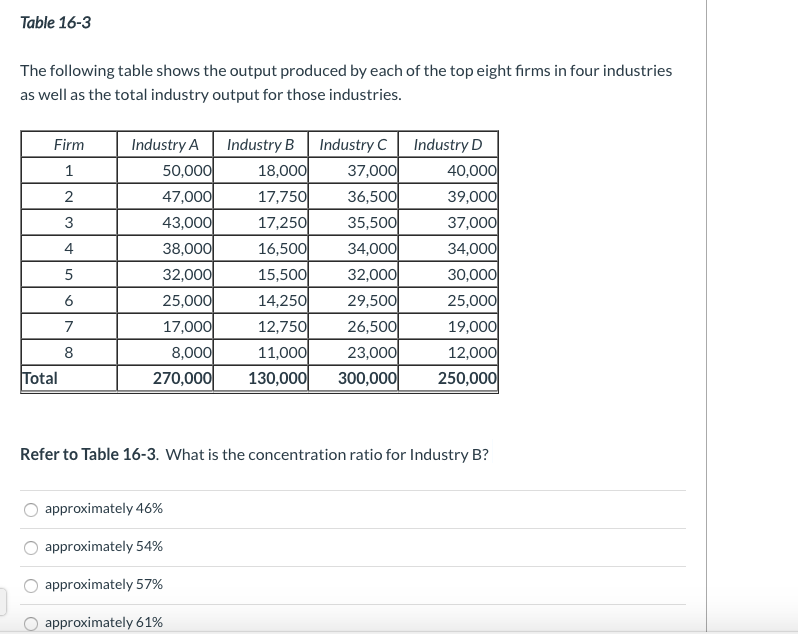
Transcribed Image Text:Table 16-3
The following table shows the output produced by each of the top eight firms in four industries
as well as the total industry output for those industries.
Firm
1
2
3
4
5
6
7
8
Total
Industry A
50,000
47,000
43,000
38,000
32,000
25,000
17,000
8,000
270,000
approximately 46%
approximately 54%
approximately 57%
Industry B Industry C
18,000
37,000
17,750
36,500
17,250
35,500
16,500
34,000
15,500
32,000
14,250
29,500
12,750
26,500
11,000
23,000
130,000 300,000
approximately 61%
Industry D
Refer to Table 16-3. What is the concentration ratio for Industry B?
40,000
39,000
37,000
34,000
30,000
25,000
19,000
12,000
250,000
Expert Solution
This question has been solved!
Explore an expertly crafted, step-by-step solution for a thorough understanding of key concepts.

This is a popular solution!

Trending now
This is a popular solution!

Step by step
Solved in 3 steps

Knowledge Booster


Learn more about
Need a deep-dive on the concept behind this application? Look no further. Learn more about this topic, economics and related others by exploring similar questions and additional content below.Recommended textbooks for you
Exploring Economics
Economics
ISBN:
9781544336329
Author:
Robert L. Sexton
Publisher:
SAGE Publications, Inc
Exploring Economics
Economics
ISBN:
9781544336329
Author:
Robert L. Sexton
Publisher:
SAGE Publications, Inc