Task 2- Below is a hypothetical demand and supply for apartments. Answe the following questions below using as basis the schedule given: Rent/Month (Php) Number of Apts. Demanded/Month Number of Apts. Supplied/Month 120.000 200 100.000 20.000 400 80,000 40,000 600 60.000 60,000 800 40,000 80.000 1000 20.000 100.000 1200 120.000 1. Draw the demand and supply curves for apartments using the schedule above.
Task 2- Below is a hypothetical demand and supply for apartments. Answe the following questions below using as basis the schedule given: Rent/Month (Php) Number of Apts. Demanded/Month Number of Apts. Supplied/Month 120.000 200 100.000 20.000 400 80,000 40,000 600 60.000 60,000 800 40,000 80.000 1000 20.000 100.000 1200 120.000 1. Draw the demand and supply curves for apartments using the schedule above.

Chapter19: Using Economics To Understand The World Around You
Section: Chapter Questions
Problem 5E

Related questions
Question
answer #1 only :))
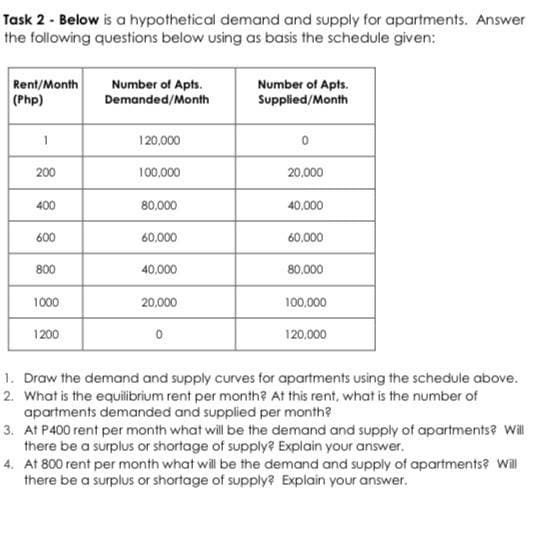
Transcribed Image Text:Task 2 - Below is a hypothetical demand and supply for apartments. Answer
the following questions below using as basis the schedule given:
Rent/Month
(Php)
Number of Apts.
Demanded/Month
Number of Apts.
Supplied/Month
120.000
200
100,000
20,000
400
80,000
40.000
600
60,000
60.000
800
40.000
80,000
1000
20,000
100,000
1200
120.000
1. Draw the demand and supply curves for apartments using the schedule above.
2. What is the equilibrium rent per month? At this rent, what is the number of
apartments demanded and supplied per month?
3. At P400 rent per month what will be the demand and supply of apartments? Wll
there be a surplus or shortage of supply? Explain your answer.
4. At 800 rent per month what will be the demand and supply of apartments? Will
there be a surplus or shortage of supply? Explain your answer.
Expert Solution
This question has been solved!
Explore an expertly crafted, step-by-step solution for a thorough understanding of key concepts.

Step by step
Solved in 2 steps with 1 images

Recommended textbooks for you