The following data represent the dividend yields (in percent) of a random sample of 28 publicly traded stocks. Compute the five-number summary for the data. 2.03 0.24 0.66 0.92 0.43 2.95 1.34 1.21 2.98 0.12 0.11 1.84 0.12 2.92 0.01 2.96 0.56 1.06 0.04 2.99 3.57 0.62 0.33 2.27 The five-number summary is.. II (Round to three decimal places as needed. Use ascending order.)


Q: 1 In the game of roulette, a player can place a $6 bet on the number 6 and have a probability of win...
A:
Q: A frequency distribution is shown below. Complete parts (a) and (b). The number of televisions per h...
A: Given : A frequency dist. is shown below The no. of televisions per households in a small town given...
Q: STATISTICS: Regression and linear equeation Regression Equation: ___________ 1. if a man's ...
A: Given table : X Y XY X2X2 Y2Y2 1 45 99 4455 2025 9801 2 34 65 2210 1156 4225 3 54 79 4266...
Q: Do doctors in managed-care plans give less charity care? Researchers chose 60 communities at random ...
A: Introduction: It is required to correctly describe the meaning of "significantly less" in this conte...
Q: A frequency distribution is shown below. Complete parts (a) and (b). The number of televisions per h...
A:
Q: Find the standard deviation of the following distribution : 40-45 40 30-35 35-40 45-50 25-30 110 20-...
A:
Q: Problem It was assumed that creativity is normally distributed in the population having X= 100 and o...
A:
Q: Q2. A researcher tossed a 1000 times and used the number of Heads to conclude that Pr(Head) = 0.5. I...
A: Given that A researcher tossed 1000 times and used the number of heads to conclude that P(Head) = 0...
Q: From the data given below, calculate the gross and net reproduction rates : Age Group Female Populat...
A:
Q: 8. The mean life of a battery is 50 hours with a standard deviation of 6 hours. The manufacturer adv...
A: Disclaimer : Since you have asked multiple question, we will solve the one question for you. If you ...
Q: 3. How was the data collected?
A: Data collection is an important part because the whole analysis will depend upon the collected data....
Q: A survey was conducted on 60 students regarding their chocolate brand preferences. 31 students prefe...
A:
Q: There were three groups of tribal people and there Cephalic index were measure. The following are th...
A:
Q: T5. Ten women are randomly selected and their weights (in Ibs.) before and afier they are put on a n...
A:
Q: In a study of cell phone use and brain hemispheric dominance, an Internet survey was emailed to 5000...
A: Given: Sample size(N)=5000 Level of significance = 0.01.
Q: A sample of 60 obese adults was put on a low carbohydrate diet for a year. The average weight loss w...
A: Based on the technology, Descriptive Statistics N Mean StDev SE Mean 99% Lower Boundfor μ 60 ...
Q: - 6 If regression coefficient of y on x (byx) = - 0.61 and regression coefficient x on y (bxv) = - 0...
A:
Q: One pair of students ended up with a significant difference from expected, as their coin tosses resu...
A: When the sample size is quite large according to central limit theorem the sample will follow a norm...
Q: What is the 40th percentile of wait times for customers calling the help line?
A: Here given Amount of time customer wait is exponentially distributed with mean 7.5 minutes
Q: 1. A company is contemplating the introduction of a new product with new packing to replace the exis...
A:
Q: Calculate the quartile deviation and its Coefficient from the following data. Class-Interval Frequen...
A:
Q: Use the probability distribution to complete parts (a) and (b) below. The number of defects per 1000...
A:
Q: 6. Using an appropriate formula for interpolation, estimate the mumber of students who obtained less...
A: Given data is the obtained marks of students. By using Newton Gregory forward interpolation we have...
Q: Use the probability distribution to complete parts (a) through (d) below. The probability distributi...
A:
Q: A researcher has devised a new questionnaire that attempts to measure a person's stress level. In do...
A: The questionnaire is the technique, which is used in survey sampling in order to obtain some informa...
Q: If n=100 and p' (p-prime) = 0.18, construct a 99% confidence interval. Give your answers to three d...
A: Givensample size(n)=100p^=0.18confidence interval (c)=99%
Q: Let X denote the reaction time, in seconds, to a certain stimulus and Y denote the temperature (°F) ...
A:
Q: In a trivariate distribution, if r12 0:7, r13 = 0.61 and r23 correlation coefficients. Also obtain t...
A:
Q: please make your handwriting clear
A: Hi! Thank you for the question, As per the honor code, we are allowed to answer three sub-parts at a...
Q: During courtship males of the fiddler crab sometimes build sand hoods at the entrances of their burr...
A: Resign design is the techniques which used by the researcher to make conclusion. There are five diff...
Q: What is the value of bo? A. 0.1486 B. -0.3462 C. 0.1467 D. -0.1730 • Find the predicted tip for a di...
A: Here AS PER POLICY I HAVE CALCULATED 3 SUBPART PLZ REPOST FOR REMAINING x = bill in $ y = tip in $
Q: !. sam piimg distribution will be cs PeecじT. normal マ5-マ4 = P(z> 1.667) 0,0478 (:2telse)
A:
Q: he annual sales of a company are given below. Estimate the sales for 1995 2005 282 year 1985 1990 19...
A: Here given the table for annual sale of company. We have to find out sale for 1995 by interpolation....
Q: A random sample of size 16 has 53 as mean. The sum of squares of deviations from mean is 150. Can th...
A: From the provided information, Sample size (n) = 16 Sample mean (x̄) = 53 Sum of squares of deviatio...
Q: 10. By Newton's or by any other algebraic method find the mumber of persons who probably will be tra...
A: Given the distribution table, we need to use Newtons formula to find the number of passengers if r...
Q: A random sample of size 16 has 53 as mean. The sum of squares of deviations from mean is 150. Can th...
A:
Q: Let patients taking placebo be the first group and those taking aspirin in the second group. Calcula...
A: Risk ratio is calculated by dividing the incidence of risk among the exposure of disease and the inc...
Q: Find the critical value of the problem : An increase in walking has been shown to contribute to a he...
A: Given: Level of significance = 0.02 Population standard deviation is given.
Q: Activity 3: Trace the path of the boy going to the other side of the swamp. The answer to each quest...
A: 4)Given P44
Q: The mean and Standard deviation of a distribution are 90 and 6.5 respectively. Find the coefficient ...
A: We have to find coefficient of variation. Mean =90 Standard deviation =6.5
Q: From the following table, interpolate the missing values. 4. Year 3 6. Production (in '000 tonnes) 2...
A:
Q: Discuss the concept of the "Law of Large Numbers" and its role in the discipline of probability.
A: We have to discuss the concept of the " Law of Large Numbers" and its role in the discipline of prob...
Q: How many way are there to arrange the letters in the word BALLOON? Show your work clearly. Your answ...
A: Given that The given word BALLOON Repeated letters = O and L Number of letters = 7 Repeated letter...
Q: For eight pairs of observations on two variables sales (X) and Pricing (Y), the following results we...
A:
Q: Conduct an analysis of variance. What is the value of F? 8.44 8.37 8.73 8.54 What is the value of t...
A: Use the Excel And Perform the Regression. Followings are the Steps to perform the Regression 1) Open...
Q: Problem 4 An urn consists of 30 red balls and 70 green balls. What is the probability of getting exa...
A: Given Urn- 30 red balls and 70 green balls Sample size 20 Sampling is done without replacement
Q: Five boys and four girls are to arrange themselves to form a line. How many arrangements can there b...
A: Here use permutations and concepts of total arrangement
Q: 14 Calculate the index number by using suitable formula for 1985 on the basis of 1980 from the follo...
A: Laspeyre's price index is used to measure the price of current year based on the base year. Paasches...
Q: When taking a 17 question multiple choice test, where each question has 5 possible answers, it would...
A:
Q: FIND THE STANDARD DEVIATION The number of items sold per day at a retail store, with its correspond...
A: We have the probability distribution
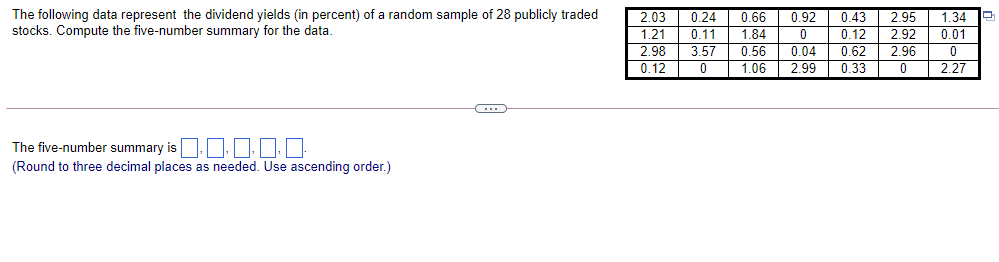
Five number summary consists of minimum, first quartile, middle , third quartile and maximum.

Trending now
This is a popular solution!

Step by step
Solved in 2 steps

- An investor is looking at past trends for three plans comparing dividends paid per share. She collects sample data from each plan to compare the average dividends paid per share. Let ? = 0.05. Plan 1 Plan 2 Plan 3 1.28 1.00 0.35 1.55 1.19 1.15 1.86 1.25 0.15 1.95 3.17 1.00 0.75 1.46 0.30 2.68 0.60 0.61 2.03 1.31 1.04 Groups Count Average Variance Plan 1 7 1.728571 0.375514 Plan 2 7 1.425714 0.667762 Plan 3 7 0.657143 0.164724 Source of Variation Sum of Squares df Mean Squares F P F crit Between Groups 4.2709 2 2.1354 5.3033 0.0155 3.5546 Within Groups 7.2480 18 0.4027 Total 11.5189 20 (a) What is the next step in the one-way ANOVA? There is not enough information, so collect more data.Stop, the results were not significant. The Tukey-Kramer post hoc test is not needed. Stop, the results were significant. The Tukey-Kramer post hoc test is not needed.Continue to the Tukey-Kramer post hoc test, as the results were…A stock analyst wondered whether the mean rate of return of financial, energy and utility stocks differed over the past 5 years. He obtained a simple random sample of eight companies from each of the three sectors and obtained the 5-year rates of return shown in the following table (in percents): Financial Energy Utilities 10.76 12.72 11.88 15.05 13.91 5.86 17.01 6.43 13.46 5.07 11.19 9.90 19.50 18.79 3.95 8.16 20.73 3.44 10.38 9.60 7.11 6.75 17.40 15.70 Source: Morningstar.com Required: (a) State the null and alternative hypothesis. (b) Are the mean rates of return different at the alpha = 0.05 level of significance? Please explain your answer, citing numeric and other evidence in support of your response.Suppose that a random sample or size n = 5 was selected from the vineyard properties for sale in Sonoma County, California, in each of 3 years. The following data are consistent with summary information on price per acre (in dollars, rounded to the nearest thousand) for disease resistant grape vineyards in Sonoma County ( Wines and Vines, November 1999). l 996 30,000 34,000 36,000 38,000 40,000 1997 30,000 35,000 37,000 38,000 40,000 1998 40,000 41,000 43,000 44,000 50,000 a. Construct boxplots for each of the 3years on a common axis, and label each by year. Comment on the similarities and b. Carry out an ANOVA to determine whether there is evidence to support the claim that the mean price per acre for vineyard land in Sonoma County was not the same for the 3years Use a significance level of 0.05 for your test.
- The following data give the numbers of orders received for a sample of 30 items at the Time-saver Mail Order Company.34 44 31 52 41 47 38 35 32 3928 24 46 41 49 53 57 33 27 3730 27 45 38 34 46 36 30 47 50 1.3 Calculate the coefficient of variation and interpret the value obtained.The following data represent the cost of electricity during July 2006 for a random sample of 50 one-bedroom apartments in a large city: Raw Data Utility Charges ($) 96 171 202 178 147 102 153 197 127 82 157 185 90 116 172 111 148 213 130 165 141 149 206 175 123 128 144 168 109 167 95 163 150 154 130 143 187 166 139 149 108 119 183 151 114 135 191 137 129 158 Form a frequency distribution and a percentage distribution that have class intervals with the upper class limits $99, $119, and so on. (Hint: It means that the first class can be expressed as $80 but less than $100, where $100 is not included in the first class but the second class.)…A stock analyst wondered whether the mean rate of return of financial, energy, and utility stocks differed over the past 5 years. He obtained a simple random sample of eight companies from each of the three sectors and obtained the 5-year rates of return shown in the accompanying table (in percent). financial energy utilities 10.76 12.89 11.88 15.05 13.96 5.86 17.21 6.43 13.67 5.07 11.23 9.90 19.50 18.93 3.95 8.16 20.73 3.44 10.38 9.60 7.11 6.52 17.40 15.70 1. Are the mean rates of return different at the α=0.05 level of significance? Use technology to find the F-test statistic for this data set. F0=______? (Round to two decimal places as needed.) 2. Determine the P-value and state the appropriate conclusion below. Since the P-value is _____? there is not enough evidence to…
- A stock analyst wondered whether the mean rate of return of financial, energy, and utility stocks differed over the past 5 years. He obtained a simple random sample of eight companies from each of the three sectors and obtained the 5-year rates of return shown in the following table (in percent): Financial Energy Utilities 10.76 12.72 11.88 15.05 13.91 5.86 17.01 6.43 13.46 5.07 11.19 9.9 19.50 18.79 3.95 8.16 20.73 3.44 10.38 9.60 7.11 6.75 17.40 15.70 (a) State the null and alternative hypotheses. (b) Verify that the requirements to use the one-way ANOVA procedure are satisfied. Normal probability plots indicate that the sample data come from normal populations. (c) Are the mean rates of return different at the a=0.05 level of significance?the following data represent the tie betwee eruption (in seconds) for a random sample of 15 eruptions at the old faithful geyser in california. is there reason to believe the time between eruptions is normally distributed? provide the graph 678 708 708 714 716 719 722 723 726 728 730 735 735 736 736c. The proportion of buyers who actually make a purchase appears to be relatively constant over time. In 2015, among a sample of 389 on-line buyers, 159 purchased merchandise. In 2019, for a sample of 301 on-line buyers, 138 purchased merchandise. At the .05 level of significance, did the proportion of on-line buyers change from 2015 to 2019?
- The table below shows the average annual tuition and fees at private and public 4-year colleges and universities for the school years 2009-2010 through 2014-2015. (Source: National Center for Education Statistics). Year Private Public2009-2010 31,448 15,0142010-2011 32,617 15,9182011-2012 33,674 16,8052012-2013 35,074 17,4742013-2014 36,193 18,3722014-2015 37,385 19,203 a. Using 1 for 2009-2010, 2 for 2010-2011, and so on, find the equation of the regression line for the tuition and fees at private 4-year colleges and universities, based on the year. b. Using 1 for 2009-2010, 2 for 2010-2011, and so on, find the correlation coefficient for the tuition and fees at public 4-year colleges and universities, based on the year.Suppose that a random sample of size n = 5 was selected from the vineyard properties for sale in Sonoma County, California in each of 3 years. Suppose the following data are consistent with summary information on price per acre (in dollars, rounded to the nearest thousand) for disease-resistant grape vineyards in Sonoma County: Year Observations 1996 30,000 32,000 34,000 39,000 40,000 1997 30,000 33,000 35,000 39,000 40,000 1998 40,000 43,000 45,000 49,000 50,000 Calculate the mean square for treatments (MSTr), the mean square error (MSE), and the value for the F statistic. (Round your answers for MSTr and MSE to the nearest integer and round your answer for F to two decimal places.) MSTr=MSE=F=The 2006 Statistical Abstract of the United States reports on a survey that asked a national sample of 80,000 American households about pet ownership. Suppose (for now) that one-third of all American households own a pet cat. Still supposing that one-third of all American households own a pet cat, between what two values do you expect 95% of all sample proportions to fall?