Temperature (°F) Use the given frequency distribution to find the (a) class width. (b) class midpoints. (c) class boundaries. Frequency 35-39 1 40-44 45-49 50-54 11 55-59 7 60-64 7 65-69 1 ..... (a) What is the class width? 5 (Type an integer or a decimal.) (b) What are the class midpoints? Complete the table below. (Type integers or decimals.) Temperature (°F) Frequency Midpoint 35-39 1 40-44 3 45-49 5 50-54 11 55-59 7 60-64 7 65-69 1
Temperature (°F) Use the given frequency distribution to find the (a) class width. (b) class midpoints. (c) class boundaries. Frequency 35-39 1 40-44 45-49 50-54 11 55-59 7 60-64 7 65-69 1 ..... (a) What is the class width? 5 (Type an integer or a decimal.) (b) What are the class midpoints? Complete the table below. (Type integers or decimals.) Temperature (°F) Frequency Midpoint 35-39 1 40-44 3 45-49 5 50-54 11 55-59 7 60-64 7 65-69 1

Big Ideas Math A Bridge To Success Algebra 1: Student Edition 2015
1st Edition
ISBN:9781680331141
Author:HOUGHTON MIFFLIN HARCOURT
Publisher:HOUGHTON MIFFLIN HARCOURT
Chapter11: Data Analysis And Displays
Section11.4: Two-ways Tables
Problem 16E

Related questions
Question
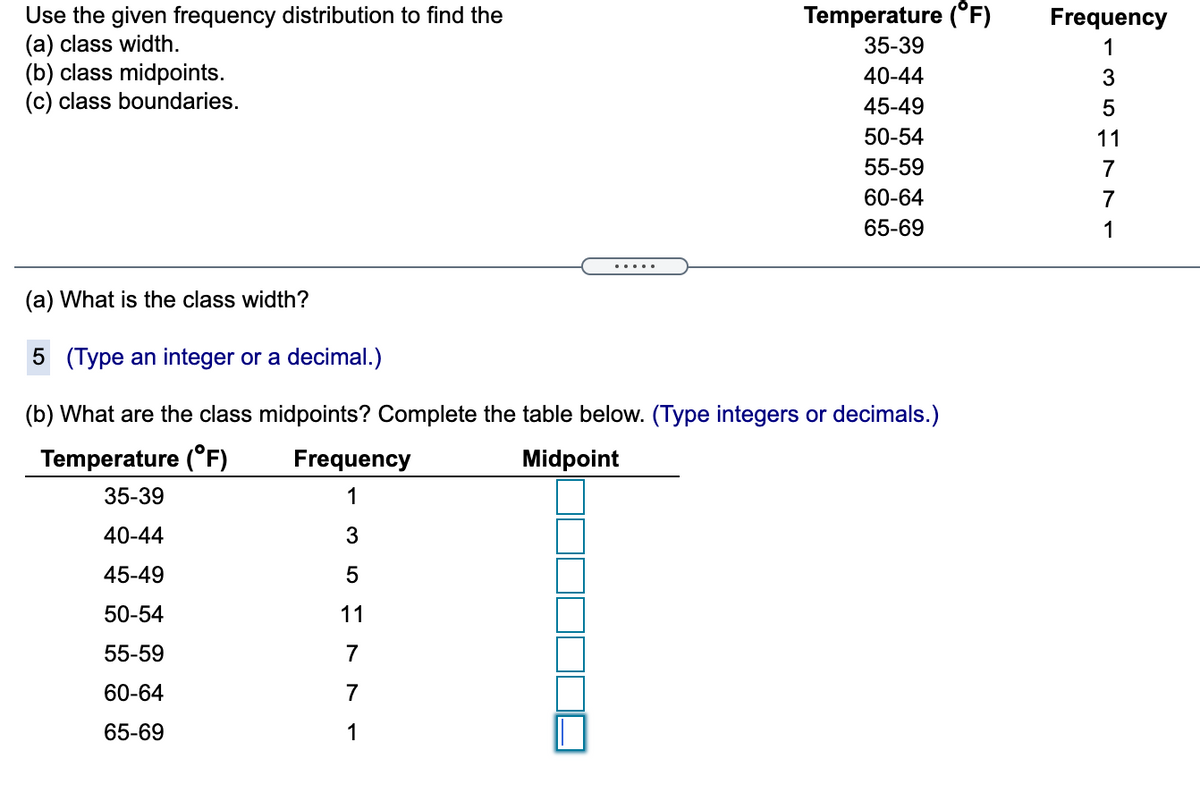
Transcribed Image Text:Temperature (°F)
Use the given frequency distribution to find the
(a) class width.
(b) class midpoints.
(c) class boundaries.
Frequency
35-39
1
40-44
3
45-49
50-54
11
55-59
7
60-64
7
65-69
1
.....
(a) What is the class width?
5 (Type an integer or a decimal.)
(b) What are the class midpoints? Complete
table below. (Type integers or decimals.)
Temperature (°F)
Frequency
Midpoint
35-39
1
40-44
45-49
50-54
11
55-59
7
60-64
7
65-69
1
Expert Solution
This question has been solved!
Explore an expertly crafted, step-by-step solution for a thorough understanding of key concepts.

This is a popular solution!

Trending now
This is a popular solution!

Step by step
Solved in 4 steps with 4 images

Recommended textbooks for you
Big Ideas Math A Bridge To Success Algebra 1: Stu…
Algebra
ISBN:
9781680331141
Author:
HOUGHTON MIFFLIN HARCOURT
Publisher:
Houghton Mifflin Harcourt
Big Ideas Math A Bridge To Success Algebra 1: Stu…
Algebra
ISBN:
9781680331141
Author:
HOUGHTON MIFFLIN HARCOURT
Publisher:
Houghton Mifflin Harcourt