Ten samples of 15 parts each were taken from an ongoing process to establish a p-chart for control. The samples and the number of defectives in each are shown in the following table. SAMPLE ANAS6TBSD 2 5 7 8 Р Sp 9 10 SHHHHHHHHHH n 15 15 15 15 15 15 15 15 15 15 NUMBER OF DEFECTIVE ITEMS IN THE SAMPLE H3222ONHMN 1 1 a. Determine the p. Sp UCL and LCL for a p-chart of 95 percent confidence (1.96 standard deviations). (Leave no cells blank. Round up any negative LCL value to "O". Round your answers to 3 decimal places.)
Ten samples of 15 parts each were taken from an ongoing process to establish a p-chart for control. The samples and the number of defectives in each are shown in the following table. SAMPLE ANAS6TBSD 2 5 7 8 Р Sp 9 10 SHHHHHHHHHH n 15 15 15 15 15 15 15 15 15 15 NUMBER OF DEFECTIVE ITEMS IN THE SAMPLE H3222ONHMN 1 1 a. Determine the p. Sp UCL and LCL for a p-chart of 95 percent confidence (1.96 standard deviations). (Leave no cells blank. Round up any negative LCL value to "O". Round your answers to 3 decimal places.)

Practical Management Science
6th Edition
ISBN:9781337406659
Author:WINSTON, Wayne L.
Publisher:WINSTON, Wayne L.
Chapter2: Introduction To Spreadsheet Modeling
Section: Chapter Questions
Problem 20P: Julie James is opening a lemonade stand. She believes the fixed cost per week of running the stand...

Related questions
Question
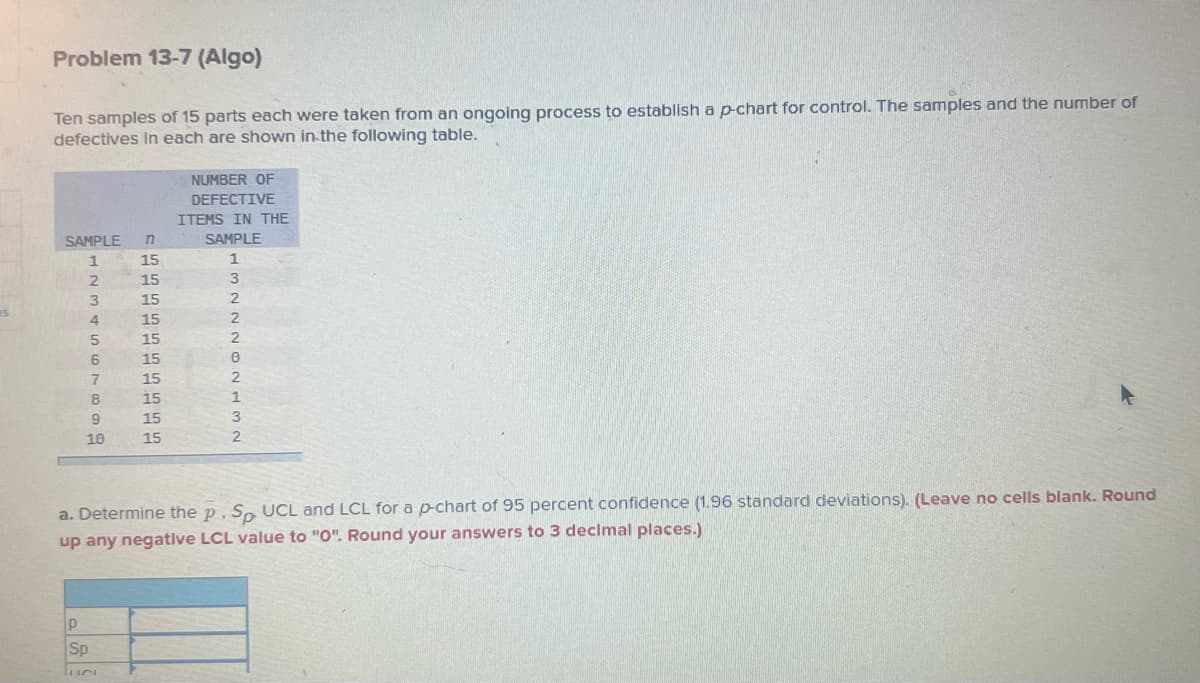
Transcribed Image Text:Problem 13-7 (Algo)
Ten samples of 15 parts each were taken from an ongoing process to establish a p-chart for control. The samples and the number of
defectives in each are shown in the following table.
SAMPLE
1
L23456TBSG
: 15 15 15 15 15 15 15 15 15 15
7
8
9
10
n
P
Sp
lucu
NUMBER OF
DEFECTIVE
ITEMS IN THE
SAMPLE
1
3
2
2
22724N
a. Determine the p. Sp. UCL and LCL for a p-chart of 95 percent confidence (1.96 standard deviations). (Leave no cells blank. Round
up any negative LCL value to "O". Round your answers to 3 decimal places.)
Transcribed Image Text:ook
int
-int
rences
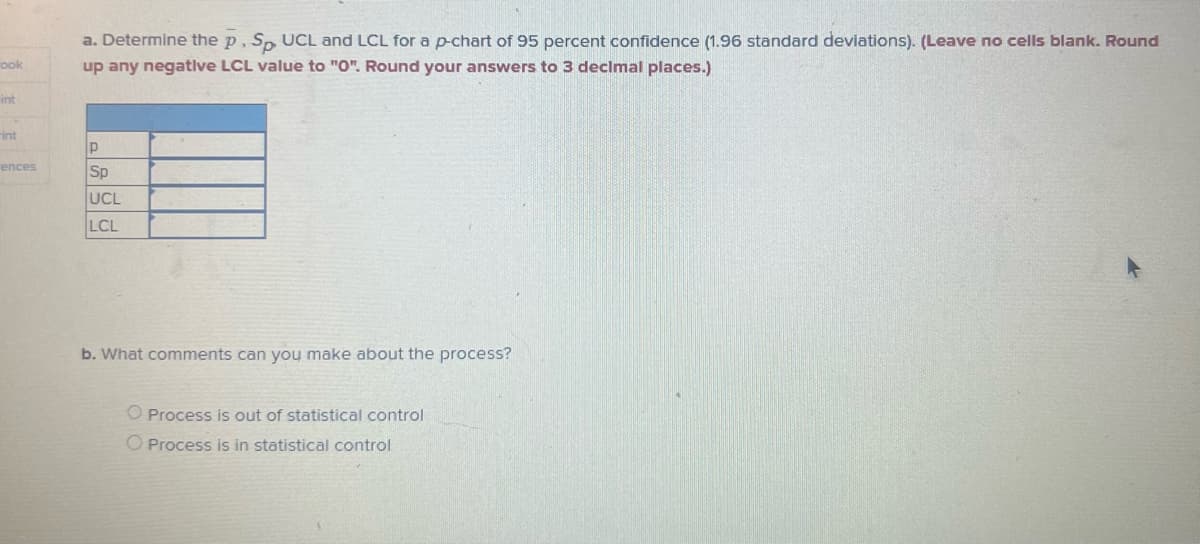
a. Determine the p, Sp, UCL and LCL for a p-chart of 95 percent confidence (1.96 standard deviations). (Leave no cells blank. Round
up any negative LCL value to "0". Round your answers to 3 decimal places.)
P
Sp
UCL
LCL
b. What comments can you make about the process?
O Process is out of statistical control
O Process is in statistical control
Expert Solution
This question has been solved!
Explore an expertly crafted, step-by-step solution for a thorough understanding of key concepts.

This is a popular solution!

Trending now
This is a popular solution!

Step by step
Solved in 2 steps with 3 images

Recommended textbooks for you
Practical Management Science
Operations Management
ISBN:
9781337406659
Author:
WINSTON, Wayne L.
Publisher:
Cengage,

Operations Management
Operations Management
ISBN:
9781259667473
Author:
William J Stevenson
Publisher:
McGraw-Hill Education

Operations and Supply Chain Management (Mcgraw-hi…
Operations Management
ISBN:
9781259666100
Author:
F. Robert Jacobs, Richard B Chase
Publisher:
McGraw-Hill Education
Practical Management Science
Operations Management
ISBN:
9781337406659
Author:
WINSTON, Wayne L.
Publisher:
Cengage,
Operations Management
Operations Management
ISBN:
9781259667473
Author:
William J Stevenson
Publisher:
McGraw-Hill Education
Operations and Supply Chain Management (Mcgraw-hi…
Operations Management
ISBN:
9781259666100
Author:
F. Robert Jacobs, Richard B Chase
Publisher:
McGraw-Hill Education


Purchasing and Supply Chain Management
Operations Management
ISBN:
9781285869681
Author:
Robert M. Monczka, Robert B. Handfield, Larry C. Giunipero, James L. Patterson
Publisher:
Cengage Learning

Production and Operations Analysis, Seventh Editi…
Operations Management
ISBN:
9781478623069
Author:
Steven Nahmias, Tava Lennon Olsen
Publisher:
Waveland Press, Inc.