At a significance level of 0.05 and looking at the P-values, vhich of the following conclusion is correct? . The mean resistivity of the wafer is affected by the furnace position. I. The mean resistivity of the wafer is not affected by the implant dose O Neither I nor II O l only O inconclusive O Both I and II O Il only
At a significance level of 0.05 and looking at the P-values, vhich of the following conclusion is correct? . The mean resistivity of the wafer is affected by the furnace position. I. The mean resistivity of the wafer is not affected by the implant dose O Neither I nor II O l only O inconclusive O Both I and II O Il only

MATLAB: An Introduction with Applications
6th Edition
ISBN:9781119256830
Author:Amos Gilat
Publisher:Amos Gilat
Chapter1: Starting With Matlab
Section: Chapter Questions
Problem 1P

Related questions
Question
35
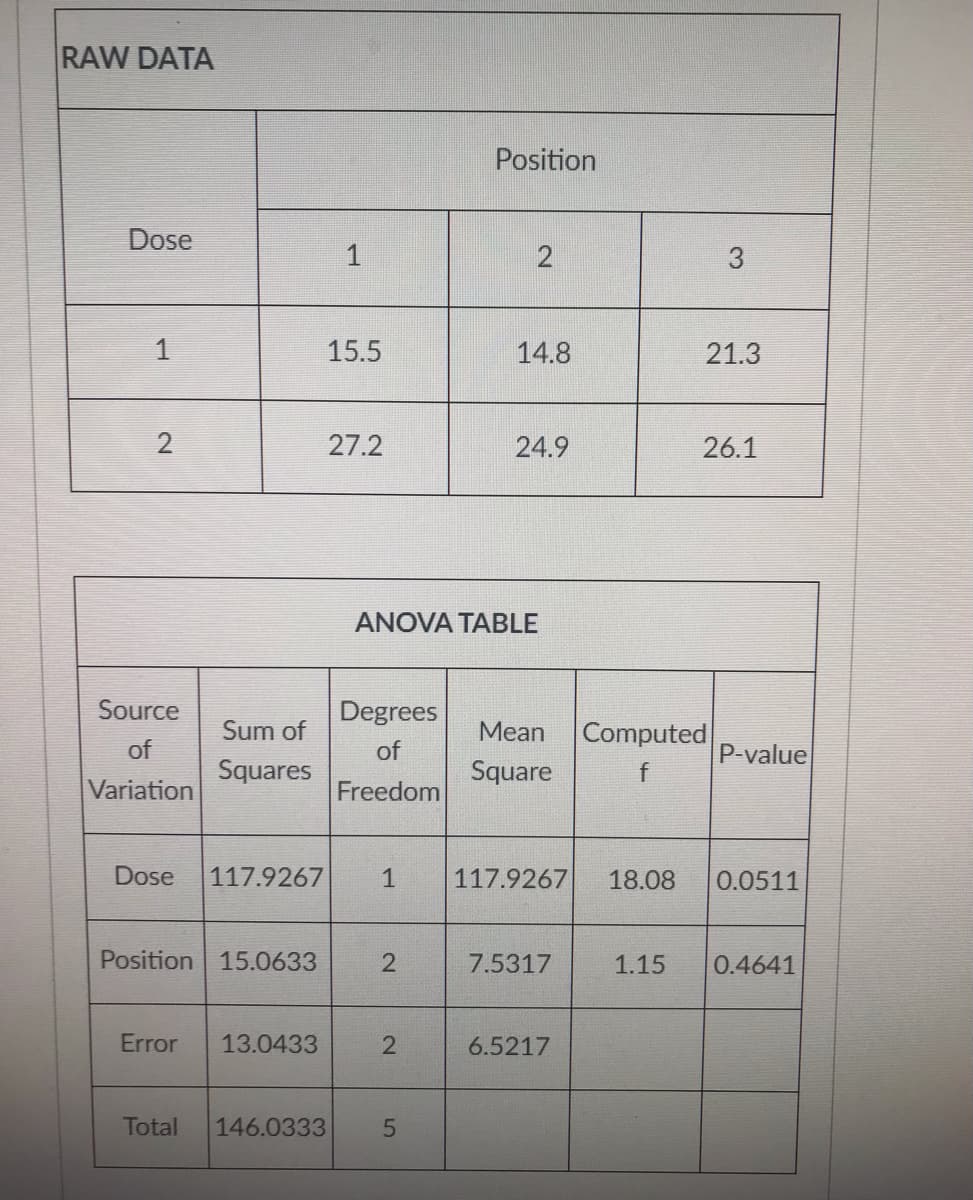
Transcribed Image Text:RAW DATA
Position
Dose
3
1
15.5
14.8
21.3
27.2
24.9
26.1
ANOVA TABLE
Source
Degrees
Sum of
Mean
Computed
of
of
P-value
Squares
Square
Variation
Freedom
Dose
117.9267
1
117.9267
18.08
0.0511
Position 15.0633
7.5317
1.15
0.4641
Error
13.0433
6.5217
Total
146.0333
2.
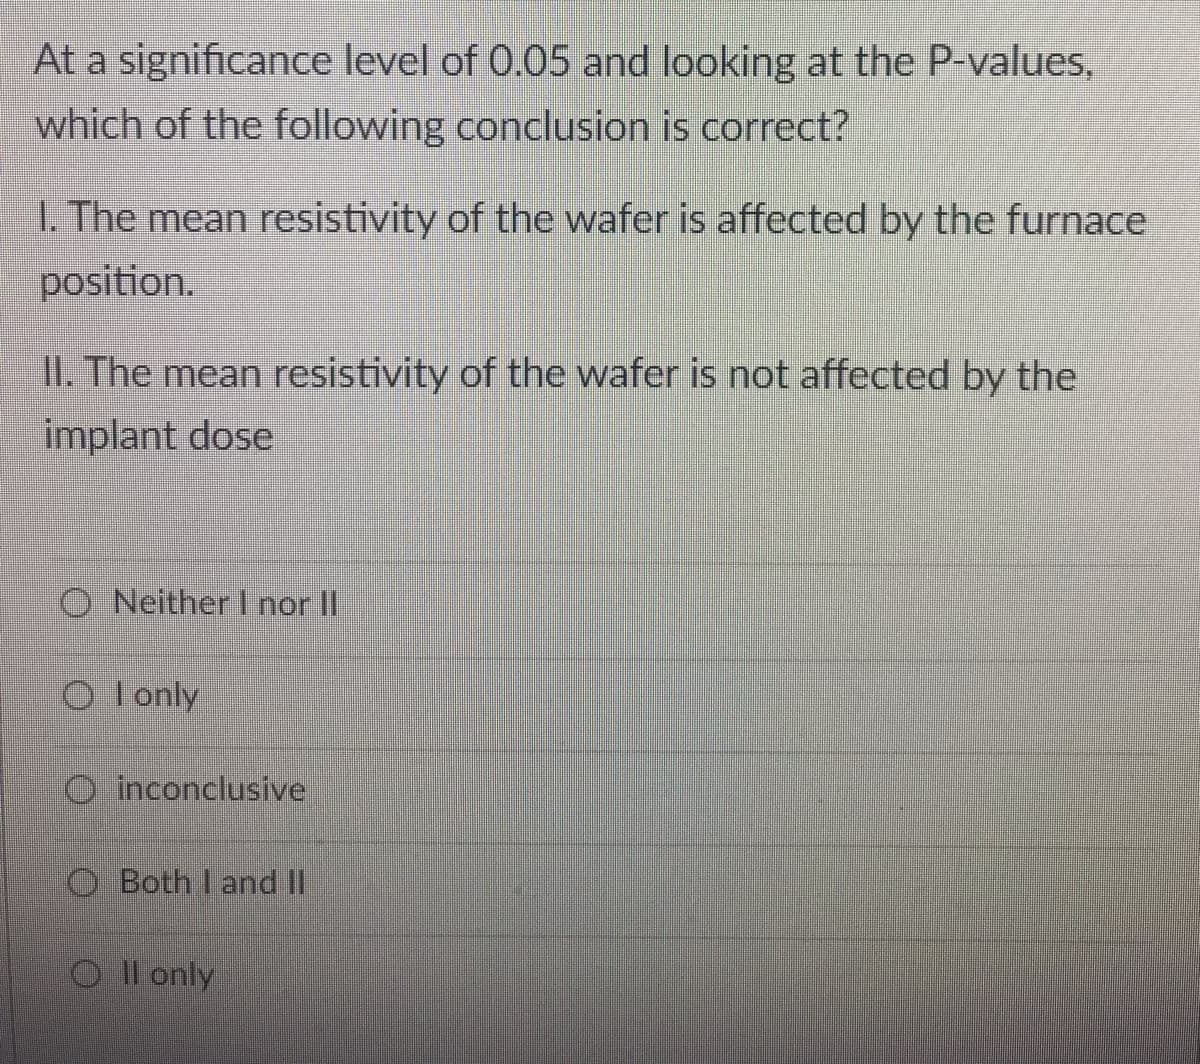
Transcribed Image Text:At a significance level of 0.05 and looking at the P-values,
which of the following conclusion is correct?
1. The mean resistivity of the wafer is affected by the furnace
position.
II. The mean resistivity of the wafer is not affected by the
implant dose
O Neither I nor II
O lonly
O inconclusive
O Both I and II
O Il only
Expert Solution
This question has been solved!
Explore an expertly crafted, step-by-step solution for a thorough understanding of key concepts.

This is a popular solution!

Trending now
This is a popular solution!

Step by step
Solved in 2 steps with 1 images

Recommended textbooks for you
MATLAB: An Introduction with Applications
Statistics
ISBN:
9781119256830
Author:
Amos Gilat
Publisher:
John Wiley & Sons Inc

Probability and Statistics for Engineering and th…
Statistics
ISBN:
9781305251809
Author:
Jay L. Devore
Publisher:
Cengage Learning

Statistics for The Behavioral Sciences (MindTap C…
Statistics
ISBN:
9781305504912
Author:
Frederick J Gravetter, Larry B. Wallnau
Publisher:
Cengage Learning
MATLAB: An Introduction with Applications
Statistics
ISBN:
9781119256830
Author:
Amos Gilat
Publisher:
John Wiley & Sons Inc
Probability and Statistics for Engineering and th…
Statistics
ISBN:
9781305251809
Author:
Jay L. Devore
Publisher:
Cengage Learning
Statistics for The Behavioral Sciences (MindTap C…
Statistics
ISBN:
9781305504912
Author:
Frederick J Gravetter, Larry B. Wallnau
Publisher:
Cengage Learning

Elementary Statistics: Picturing the World (7th E…
Statistics
ISBN:
9780134683416
Author:
Ron Larson, Betsy Farber
Publisher:
PEARSON

The Basic Practice of Statistics
Statistics
ISBN:
9781319042578
Author:
David S. Moore, William I. Notz, Michael A. Fligner
Publisher:
W. H. Freeman

Introduction to the Practice of Statistics
Statistics
ISBN:
9781319013387
Author:
David S. Moore, George P. McCabe, Bruce A. Craig
Publisher:
W. H. Freeman