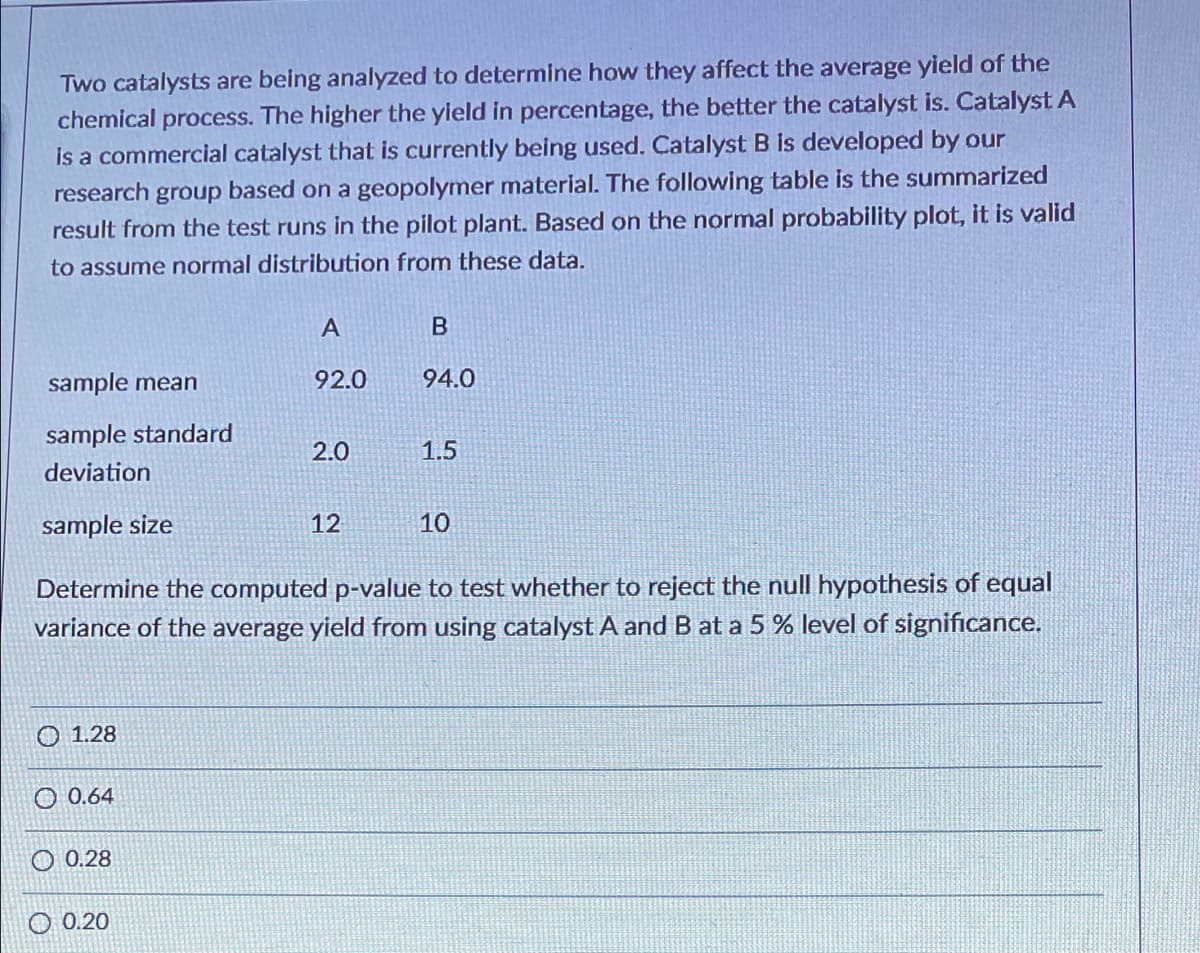
Two catalysts are being analyzed to determine how they affect the average yield of the chemical process. The higher the yield in percentage, the better the catalyst is. Catalyst A is a commercial catalyst that is currently being used. Catalyst B is developed by our research group based on a geopolymer material. The following table is the summarized result from the test runs in the pilot plant. Based on the normal probability plot, it is valid to assume normal distribution from these data. A sample mean 92.0 94.0 sample standard 2.0 1.5 deviation sample size 12 10 Determine the computed p-value to test whether to reject the null hypothesis of equal variance of the average yield from using catalyst A and B at a 5 % level of significance. O 1.28 O 0.64 O 0.28 O 0.20
Two catalysts are being analyzed to determine how they affect the average yield of the chemical process. The higher the yield in percentage, the better the catalyst is. Catalyst A is a commercial catalyst that is currently being used. Catalyst B is developed by our research group based on a geopolymer material. The following table is the summarized result from the test runs in the pilot plant. Based on the normal probability plot, it is valid to assume normal distribution from these data. A sample mean 92.0 94.0 sample standard 2.0 1.5 deviation sample size 12 10 Determine the computed p-value to test whether to reject the null hypothesis of equal variance of the average yield from using catalyst A and B at a 5 % level of significance. O 1.28 O 0.64 O 0.28 O 0.20

MATLAB: An Introduction with Applications
6th Edition
ISBN:9781119256830
Author:Amos Gilat
Publisher:Amos Gilat
Chapter1: Starting With Matlab
Section: Chapter Questions
Problem 1P

Related questions
Question
100%
Transcribed Image Text:Two catalysts are being analyzed to determine how they affect the average yield of the
chemical process. The higher the yield in percentage, the better the catalyst is. Catalyst A
is a commercial catalyst that is currently being used. Catalyst B is developed by our
research group based on a geopolymer material. The following table is the summarized
result from the test runs in the pilot plant. Based on the normal probability plot, it is valid
to assume normal distribution from these data.
A
sample mean
92.0
94.0
sample standard
2.0
1.5
deviation
sample size
12
10
Determine the computed p-value to test whether to reject the null hypothesis of equal
variance of the average yield from using catalyst A and B at a 5 % level of significance.
O 1.28
O 0.64
O 0.28
O 0.20
Expert Solution
This question has been solved!
Explore an expertly crafted, step-by-step solution for a thorough understanding of key concepts.

Step by step
Solved in 2 steps with 2 images

Recommended textbooks for you
MATLAB: An Introduction with Applications
Statistics
ISBN:
9781119256830
Author:
Amos Gilat
Publisher:
John Wiley & Sons Inc

Probability and Statistics for Engineering and th…
Statistics
ISBN:
9781305251809
Author:
Jay L. Devore
Publisher:
Cengage Learning

Statistics for The Behavioral Sciences (MindTap C…
Statistics
ISBN:
9781305504912
Author:
Frederick J Gravetter, Larry B. Wallnau
Publisher:
Cengage Learning
MATLAB: An Introduction with Applications
Statistics
ISBN:
9781119256830
Author:
Amos Gilat
Publisher:
John Wiley & Sons Inc
Probability and Statistics for Engineering and th…
Statistics
ISBN:
9781305251809
Author:
Jay L. Devore
Publisher:
Cengage Learning
Statistics for The Behavioral Sciences (MindTap C…
Statistics
ISBN:
9781305504912
Author:
Frederick J Gravetter, Larry B. Wallnau
Publisher:
Cengage Learning

Elementary Statistics: Picturing the World (7th E…
Statistics
ISBN:
9780134683416
Author:
Ron Larson, Betsy Farber
Publisher:
PEARSON

The Basic Practice of Statistics
Statistics
ISBN:
9781319042578
Author:
David S. Moore, William I. Notz, Michael A. Fligner
Publisher:
W. H. Freeman

Introduction to the Practice of Statistics
Statistics
ISBN:
9781319013387
Author:
David S. Moore, George P. McCabe, Bruce A. Craig
Publisher:
W. H. Freeman