Test the given claim. Identify the null hypothesis, alternative hypothesis, test statistic, P-value, and then state the conclusion about the null hypothesis, as well as the final conclusion that addresses the original claim. Among 2195 passenger cars in a particular region, 245 had only rear license plates.. Among 326 commercial trucks, 49 had only rear license plates. A reasonable hypothesis is that commercial trucks owners violate laws requiring front license plates at a higher rate than owners of passenger cars. Use a 0.10 significance level to test that hypothesis. a. Test the claim using a hypothesis test. b. Test the claim by constructing an appropriate confidence interval. Identify the test statistic. (Round to two decimal places as needed.) Identify the P-value. (Round to three decimal places as needed.) State the conclusion about the null hypothesis, as well as the final conclusion that addresses the original claim.
Test the given claim. Identify the null hypothesis, alternative hypothesis, test statistic, P-value, and then state the conclusion about the null hypothesis, as well as the final conclusion that addresses the original claim. Among 2195 passenger cars in a particular region, 245 had only rear license plates.. Among 326 commercial trucks, 49 had only rear license plates. A reasonable hypothesis is that commercial trucks owners violate laws requiring front license plates at a higher rate than owners of passenger cars. Use a 0.10 significance level to test that hypothesis. a. Test the claim using a hypothesis test. b. Test the claim by constructing an appropriate confidence interval. Identify the test statistic. (Round to two decimal places as needed.) Identify the P-value. (Round to three decimal places as needed.) State the conclusion about the null hypothesis, as well as the final conclusion that addresses the original claim.

MATLAB: An Introduction with Applications
6th Edition
ISBN:9781119256830
Author:Amos Gilat
Publisher:Amos Gilat
Chapter1: Starting With Matlab
Section: Chapter Questions
Problem 1P

Related questions
Question
100%
A) test the claim using a hypothesis test. Identify test statistic (round two decimal places) and p value (round three decimal places)
B) test the claim by constructing appropriate confidence interval.
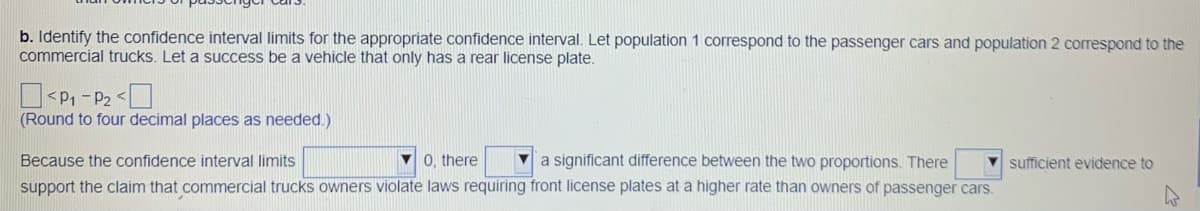
Transcribed Image Text:b. Identify the confidence interval limits for the appropriate confidence interval. Let population 1 correspond to the passenger cars and population 2 correspond to the
commercial trucks. Let a success be a vehicle that only has a rear license plate.
O<P1 - P2 <O
(Round to four decimal places as needed.)
v 0. there
Va significant difference between the two proportions. There
Because the confidence interval limits
support the claim that commercial trucks owners violate laws requiring front license plates at a higher rate than owners of passenger cars.
sufficient evidence to
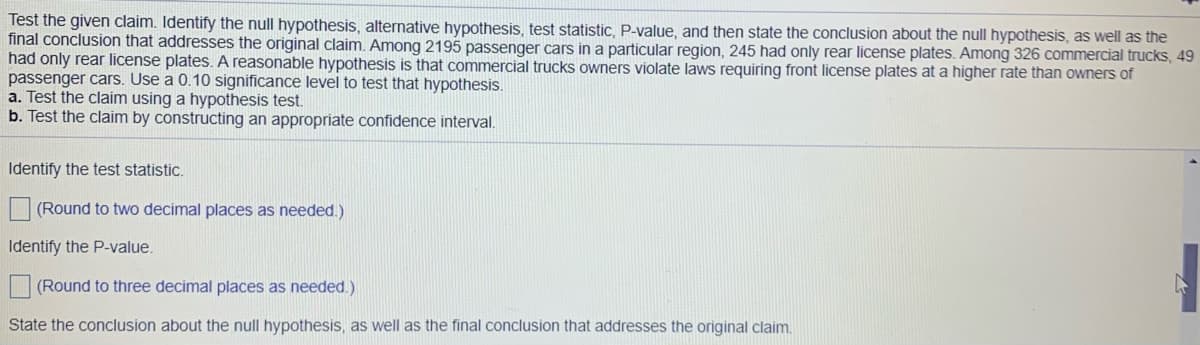
Transcribed Image Text:Test the given claim. Identify the null hypothesis, alternative hypothesis, test statistic, P-value, and then state the conclusion about the null hypothesis, as well as the
final conclusion that addresses the original claim. Among 2195 passenger cars in a particular region, 245 had only rear license plates. Among 326 commercial trucks, 49
had only rear license plates. A reasonable hypothesis is that commercial trucks owners violate laws requiring front license plates at a higher rate than owners of
passenger cars. Use a 0.10 significance level to test that hypothesis.
a. Test the claim using a hypothesis test.
b. Test the claim by constructing an appropriate confidence interval.
Identify the test statistic.
(Round to two decimal places as needed.)
Identify the P-value.
(Round to three decimal places as needed.)
State the conclusion about the null hypothesis, as well as the final conclusion that addresses the original claim.
Expert Solution
This question has been solved!
Explore an expertly crafted, step-by-step solution for a thorough understanding of key concepts.

This is a popular solution!

Trending now
This is a popular solution!

Step by step
Solved in 4 steps with 7 images

Knowledge Booster


Learn more about
Need a deep-dive on the concept behind this application? Look no further. Learn more about this topic, statistics and related others by exploring similar questions and additional content below.Recommended textbooks for you
MATLAB: An Introduction with Applications
Statistics
ISBN:
9781119256830
Author:
Amos Gilat
Publisher:
John Wiley & Sons Inc

Probability and Statistics for Engineering and th…
Statistics
ISBN:
9781305251809
Author:
Jay L. Devore
Publisher:
Cengage Learning

Statistics for The Behavioral Sciences (MindTap C…
Statistics
ISBN:
9781305504912
Author:
Frederick J Gravetter, Larry B. Wallnau
Publisher:
Cengage Learning
MATLAB: An Introduction with Applications
Statistics
ISBN:
9781119256830
Author:
Amos Gilat
Publisher:
John Wiley & Sons Inc
Probability and Statistics for Engineering and th…
Statistics
ISBN:
9781305251809
Author:
Jay L. Devore
Publisher:
Cengage Learning
Statistics for The Behavioral Sciences (MindTap C…
Statistics
ISBN:
9781305504912
Author:
Frederick J Gravetter, Larry B. Wallnau
Publisher:
Cengage Learning

Elementary Statistics: Picturing the World (7th E…
Statistics
ISBN:
9780134683416
Author:
Ron Larson, Betsy Farber
Publisher:
PEARSON

The Basic Practice of Statistics
Statistics
ISBN:
9781319042578
Author:
David S. Moore, William I. Notz, Michael A. Fligner
Publisher:
W. H. Freeman

Introduction to the Practice of Statistics
Statistics
ISBN:
9781319013387
Author:
David S. Moore, George P. McCabe, Bruce A. Craig
Publisher:
W. H. Freeman