Test the hypothesis that heating increases the diameter at the level of significance 0.01.
Q: 2.What is the area under the normal curve below the z-score of 1? GeoGebra Graphing Calculator…
A: The area under the normal curve below the z-score of 1 P(Z≤1) = 0.84
Q: Find the perimeter of the following figure by using the appropriate formula. Round approximate…
A:
Q: The thickness specification for aluminum sheets is 0.246-0.254 mm. Data from an X chart, based on…
A:
Q: Determine the largest relative error in a calculation of the cross-sectional area of a wire from a…
A: The relative error is calculated by subtracting the expected value from the actual value and…
Q: . Consider a laboratory experiment in which three different chemicals were added to culti ourpose of…
A:
Q: Find the average value of ƒ(x) = mx + b over [-1, 1]
A:
Q: What is the area above a z-score of –0.48?
A: What is the area above a z-score of –0.48?
Q: Let X be a normal rv with mean 1 and standard deviation 2. a. Find P(a < X < a+ 2) when a = 3. b.…
A: From the given information, X is a normal random variable with mean 1 and standard deviation 2. a.…
Q: The table below shows the results from the specific gravity (S.G.) test performed in a soil…
A: specific gravity samples cumulative sample 2.30-2.39 1 1 2.40-2.49 2 3…
Q: Find the average value of y = √3x over [0, 3]
A:
Q: The bottom of a cylindrical container has an area of 10 cm². The container is filled to a height…
A:
Q: Find the area and normal curve Less than z = -2.11
A:
Q: Construct a hypothesis addressing which potato piece will have the greatest surface-area-to-volume…
A: Let us first understand what do we mean by a hypothesis. A hypothesis is a statement of no…
Q: the pivot on the image has _______ distributions a) normal b) t-square c) chi square
A: We have given that the application of t-distribution i.e. test of significance of single mean. Here…
Q: Using the standard normal table, determine a z value (to two decimal places) such that the area…
A:
Q: a. Accurately sketch and shade the area under the standard normal curve that lies between z-1.25 and…
A: Question (a) Let Z be the random variable from standard normal distribution with mean = 0 and…
Q: When working with a sample of size 28, find the area under a t-curve: (a) Above -0.4. ANSWER: (b)…
A:
Q: Find the average value of the tunctlon fl)= x2 41 AG) =L b-a foldx a
A:
Q: Find the area under the standard normal curve to the right of z = 1.09
A: We need to calculate: P(z>1.09)
Q: Ise Pearson's Chi-square test statistic to find he rejection region for testing if the data resent…
A: Answer: From the given data, df = n-1 = 4-1 = 3 alpha = 0.05 Using chi square table, The critical…
Q: Using your z-score tables, find the area under the curve to the left of z = 0.40. Question 1…
A: P(z<0.40) = 0.6554
Q: Find the area below the standard normal curve to the left of z = 1.4.
A:
Q: Find the area under the standard normal curve to the right of z =1.36.
A:
Q: (a) What is the average power of X(t)?
A:
Q: 6. What is the scale factor of the dilation shown (from PQR to P'Q'R')?
A: follow next step
Q: 1. According to the data in Model 1, how many females fall within the range 146-155 cm tall? 2.…
A: Since you have posted a question with multiple subparts, we will solve first three subparts for you.…
Q: data suggest that the extra carbonation of cola results in a higher average compression strength? A
A: Given, Sample Size for Cola, n1 = 17 Sample mean for Cola, x1¯ = 554 Sample standard deviation for…
Q: 3. Determine the number of possible samples of size 3 Show your solutions here.
A: Note: Hi, thank you for the question. As per our company guideline we are supposed to answer only…
Q: Find the average value of ƒ(x) = mx + b over [-k, k]
A: Given: fx=mx+b; x∈-k,k we know that averagefavg value of any given functionfx over a,b is given by…
Q: Find the indicated area under the standard normal curve. Between z= 0 and z 1.06
A: The area between z=0 and z=1.06 under the standard normal curve is,…
Q: First, look up the equation for the normal curve. Now, using this equation, calculate the area under…
A: We have to find the area under the curve for a z score between 0 and 1 i.e we have to find P( 0…
Q: the z-scores for which 80% of the distribution's area lies between −z and
A: To find the z value, use the standard normal table to find the z-score which cuts off an area of…
Q: Which t-test should be used to determine if there is a statistically significant difference between…
A: Here two sample test is applicable Null Hypothesis: There is no difference between known and…
Q: A chip manufacturer has been concerned about the number of defective chips found recent order to…
A: Note: Hi there! Thank you for posting the question. As your question has more than 3 parts, we have…
Q: The statistic for reporting the effect size of a chi square is: proportionate reduction in error.…
A: In this case, we need to find the correct option for the given statement.
Q: s concrete cures, It gains strength. The following data represant the 7-day and 28-day strength in…
A: Hey, since there are multiple subparts posted, we will answer first three subparts. If you want any…
Q: Find the area and normal curve Between z = 0 and z = 1.34
A: According to the given information in this question We need to find the area of normal curve between…
Q: Consider a gas in a piston-cylinder device in which the temperature is held constant. As the volume…
A:
Q: that the new coordinate axes, while still being perpendicular, align well with sketched in part (a)…
A: *Answer:
Q: What scale should we use for the regressors? Expalain the reason?
A: Regression analysis to describe the relationships between a set of independent variables and the…
Q: Find the area under the standard normal curve to the right of z = 1.69.
A: here use excel command for Area under normal curve , here in each step respective excel commands…
Q: Is it true that z values have no units of measurements?
A: Yes,it true that z values have no units of measurements The z -value is unitless It tells the number…
Q: Find the z-scores for which 28% of the distribution's area lies between −z and z.
A: Here, the z score for which 28% of thedistribution's area lies between minus−z and z where the…
Q: Find the area under the standard normal curve to the left of z = - 0.45
A: The area left to the z=-0.45 is same as the CDF of standard normal distribution at -0.45
Q: tion, each of the two red areas represents of the area under the curve. Estimate the following…
A: d). The graph shows that the mean of the distribution is equal to 100. According to the empirical…
Q: Find the z-scores for which 15% of the distribution's area lies between −z and z.
A: To find z-scores for which 15% of the distribution's area lies between −z and z.
Q: Using your z-score tables, find the area under the curve to the right of z = -1.65. Question 2…
A: Solution: From the given information, z = –1.65.
Q: Using your z-score tables, find the area under the curve between z = 0.40 and z = 2.45.
A:
Q: ind the z score for population va
A: Find the z score for population value of 3
Q: Evaluate the mtagals inte Sex. smž dx
A:
Need help with this stat homework problem
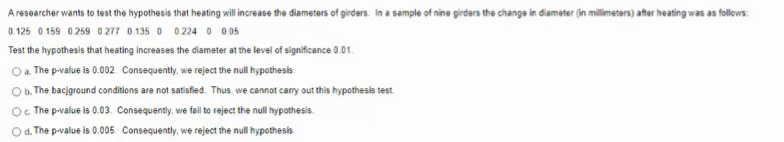
Trending now
This is a popular solution!
Step by step
Solved in 2 steps with 1 images
- A vending machine company wants to check three of its machines to determine if they are properly dispensing 12 ounces of coffee. Test by using α=0.05. Their data is given below. Machine A Machine B Machine C 11.8 11.7 12.2 12.1 11.9 12.1 12.0 11.7 12.0 11.9 11.8 11.9 12.1 12.0 12.2 Group of answer choices There is sufficient evidence to reject the claim that the proportions are equal because the p-value 0.0255 < 0.05 There is insufficient evidence to conclude the claim that the proportions are equal because the p-value 0.0255 < 0.05 There is insufficient evidence to reject the claim that the proportions are equal because the p-value 0.0255 < 0.05 There is sufficient evidence to conclude the claim that the proportions are equal because the p-value 0.0255 < 0.05An article includes the accompanying data on compression strength (lb) for a sample of 12-oz aluminum cans filled with strawberry drink and another sample filled with cola. Beverage Sample Size Sample Mean Sample SD Strawberry Drink 10 535 24 Cola 10 559 15 Does the data suggest that the extra carbonation of cola results in a higher average compression strength? Base your answer on a P-value. (Use ? = 0.05.) State the relevant hypotheses. (Use ?1 for the strawberry drink and ?2 for the cola.) H0: ?1 − ?2 = 0Ha: ?1 − ?2 ≥ 0H0: ?1 − ?2 = 0Ha: ?1 − ?2 ≠ 0 H0: ?1 − ?2 = 0Ha: ?1 − ?2 < 0H0: ?1 − ?2 = 0Ha: ?1 − ?2 > 0 Calculate the test statistic and determine the P-value. (Round your test statistic to one decimal place and your P-value to three decimal places.) t = P-value = State the conclusion in the problem context. Reject H0. The data suggests that cola has a higher average compression strength than the strawberry drink.Reject H0. The…The true average diameter of ball bearings of a certain type is supposed to be 0.5 in. A one-sample t test will be carried out to see whether this is the case. What conclusion is appropriate in each of the following situations? (a) n = 12, t = 1.56, ? = 0.05 Reject the null hypothesis. There is sufficient evidence that the true diameter differs from 0.5 in.Reject the null hypothesis. There is not sufficient evidence that the true diameter differs from 0.5 in. Do not reject the null hypothesis. There is sufficient evidence that the true diameter differs from 0.5 in.Do not reject the null hypothesis. There is not sufficient evidence that the true diameter differs from 0.5 in. (b) n = 12, t = −1.56, ? = 0.05 Reject the null hypothesis. There is sufficient evidence that the true diameter differs from 0.5 in.Reject the null hypothesis. There is not sufficient evidence that the true diameter differs from 0.5 in. Do not reject the null hypothesis. There is sufficient evidence…
- The effectiveness of a new bug repellent is tested on 1616 subjects for a 10 hour period. (Assume normally distributed population.) Based on the number and location of the bug bites, the percentage of surface area exposed protected from bites was calculated for each of the subjects. The results were as follows: ?⎯⎯⎯=92x¯=92, ?=13 s=13 The new repellent is considered effective if it provides a percent repellency of at least 9090. Using ?=0.05α=0.05, construct a hypothesis test with null hypothesis ?≤90μ≤90 and alternative hypothesis ?>90μ>90 to determine whether the mean repellency of the new bug repellent is greater than 9090 by computing the following: (a) the degree of freedom (b) the test statistic The final conclusion is A. There is not sufficient evidence to reject the null hypothesis that ?≤90μ≤90. Our results do not provide enough evidence that the new bug repellent is effective. B. We can reject the null hypothesis that ?≤90μ≤90. Our results indicate that…A sample of 12 radon detectors of a certain type was selected, and each was exposed to 100 pCi/L of radon. The resulting readings were as follows: 105.6 90.9 91.2 96.9 96.5 91.3 100.1 105.5 99.6 107.7 103.3 92.4 Does this data suggest that the population mean reading under these conditions differ from 100? (a) State the null and alternative hypotheses. (b) Calculate, correct to 2 decimal places, (i) the sample mean, x ; and (ii) the sample standard deviation, s. (c) Evaluate the appropriate test statistic. (d) Test these hypotheses at 0.05 level of significance.The tests of assumptions for yield gave values for Levene’s statistic and Shapiro-Wilk’s as 0.0562 and .00271, respectively. At a=0.05 , which statistical test is most appropriate to compare the yield among the nitrogen rates? a. Cochran’s Q B. Friedman’s C. Kruskal Wallis test . D. Anova F-test
- A vending machine company wants to check three of its machines to determine if they are properly dispensing 12 ounces of coffee. Test by using α=0.01. Their data is given below Machine A Machine B Machine C 11.8 11.7 12.2 12.1 11.9 12.1 12.0 11.7 12.0 11.9 11.8 11.9 12.1 12.0 12.2 A. There is insufficient evidence to conclude the claim that the proportions are equal because the p-value 0.0255 >0.01 B. There is sufficient evidence to reject the claim that the proportions are equal because the p-value 0.0255 > 0.01 C. There is insufficient evidence to reject the claim that the proportions are equal because the p-value 0.0255 > 0.01 D. There is sufficient evidence to conclude the claim that the proportions are equal because the p-value 0.0255 >0.01A random sample of 480 observations produced a sample proportion equal to 0.33. Find the critical and observed values of z for the following test of hypotheses using α=0.01. H0: p=0.30 versus H1: p>0.30. Round your answers to two decimal places. zcritical= zobserved=Arandom sample of 450 observations produced a sample proportion equal to 0.38. Find the critical and observed values of z for the following test of hypotheses using alpha = 0.025 . H 0 :p=0.30 versus H 1 :p not equal to 0.30
- A sample of 12 radon detectors of a certain type was selected, and each was exposed to 100 pCi/L of radon. The resulting readings were as follows: 104.3 89.6 89.9 95.6 95.2 90.0 98.8 103.7 98.3 106.4 102.0 91.1 a)Does this data suggest that the population mean reading under these conditions differs from 100? State and test the appropriate hypotheses using =.05. b) Suppose that prior to the experiment, a value of teta=7.5 had been assumed. How many determinations would then have been appropriate to obtain beta=.10 for the alternative u=95 ?The toll plaza on Route 1 in Dover has four tollbooths open to all vehicles. Ms. Timlin conducted a chi-square goodness of fit test to see if all of the booths are used in equally. A chi-square value of 23.4 was calculated, resulting in a p-value of 0.006. Which of the following is correct? a. There is sufficient evidence to suggest that the tollbooths are not used in equal proportions. Selected:b. There is sufficient evidence to suggest that the tollbooths are used in equal proportions.This answer is incorrect. c. The tollbooths are used in equal proportions. d. There is insufficient evidence to suggest that the tollbooths are used in equal proportions. e. There is insufficient evidence to suggest that the tollbooths are not used in equal proportions.A z-score of –1.6 has a corresponding Stanine score of: