Test the hypothesis that the three class sections (section) differed in their performance on Quiz #3 (quiz3). 2 Before doing this, indicate what type of ANOVA you will perform (i.e., Independent or Dependent), state your null and alternative hypotheses, and the alpha level. Type of ANOVA: Step 1: H1: Ho: Step 2: a = 0.01 Step 3: Descriptives quiz3 95% Confidence Interval for Mean Mean N. Std. Deviation Lower Bound Upper Bound Std. Error Minimum Maximum 33 9.00 2.062 9.73 8.27 359 10 7.62 39 2.098 6.94 336 8.30 10 33 7.61 2.549 6.70 1444 8.51 10 0. Total 8.05 2.310 105 225 7.60 8,49 10 ANOVA quiz3 Sum of Squares Mean Square df Sig 21.826 4.356 015 43.652 Between Groups 5.011 102 511.110 Within Groups 104 554.762 Total Multiple Comparisons Dependent Variable: quiz3 Tukey HSD Mean Difference (l- J) 95% Confidence Interval ) section (J) section Std. Error Sig. Lower Bound Upper Bound 2. 1. 1.385 529 028 13 2.64 1.394 551 .034 08 2.70 2. 1 -1.385 .529 .028 -2.64 -.13 3. 009 529 1.000 -1.25 1.27 1 3) -1.394 551 034 -2.70 -.08 2. 009 529 *. The mean difference is significant at the 0.05 level. -1.27 1.000 1.25 df values- Significance = F= %3D Are post-hoc tests needed? (circle one): Yes No Based on the SPSS output, state the conclusion you reached. Specifically, indicate (1) whether you reject or did not reject the null hypothesis and (2) write up the results using the format you see on the board (make sure to include the results of the post-hoc tests only if needed). 3.
Test the hypothesis that the three class sections (section) differed in their performance on Quiz #3 (quiz3). 2 Before doing this, indicate what type of ANOVA you will perform (i.e., Independent or Dependent), state your null and alternative hypotheses, and the alpha level. Type of ANOVA: Step 1: H1: Ho: Step 2: a = 0.01 Step 3: Descriptives quiz3 95% Confidence Interval for Mean Mean N. Std. Deviation Lower Bound Upper Bound Std. Error Minimum Maximum 33 9.00 2.062 9.73 8.27 359 10 7.62 39 2.098 6.94 336 8.30 10 33 7.61 2.549 6.70 1444 8.51 10 0. Total 8.05 2.310 105 225 7.60 8,49 10 ANOVA quiz3 Sum of Squares Mean Square df Sig 21.826 4.356 015 43.652 Between Groups 5.011 102 511.110 Within Groups 104 554.762 Total Multiple Comparisons Dependent Variable: quiz3 Tukey HSD Mean Difference (l- J) 95% Confidence Interval ) section (J) section Std. Error Sig. Lower Bound Upper Bound 2. 1. 1.385 529 028 13 2.64 1.394 551 .034 08 2.70 2. 1 -1.385 .529 .028 -2.64 -.13 3. 009 529 1.000 -1.25 1.27 1 3) -1.394 551 034 -2.70 -.08 2. 009 529 *. The mean difference is significant at the 0.05 level. -1.27 1.000 1.25 df values- Significance = F= %3D Are post-hoc tests needed? (circle one): Yes No Based on the SPSS output, state the conclusion you reached. Specifically, indicate (1) whether you reject or did not reject the null hypothesis and (2) write up the results using the format you see on the board (make sure to include the results of the post-hoc tests only if needed). 3.

College Algebra (MindTap Course List)
12th Edition
ISBN:9781305652231
Author:R. David Gustafson, Jeff Hughes
Publisher:R. David Gustafson, Jeff Hughes
Chapter8: Sequences, Series, And Probability
Section8.7: Probability
Problem 58E: What is meant by the sample space of an experiment?

Related questions
Question
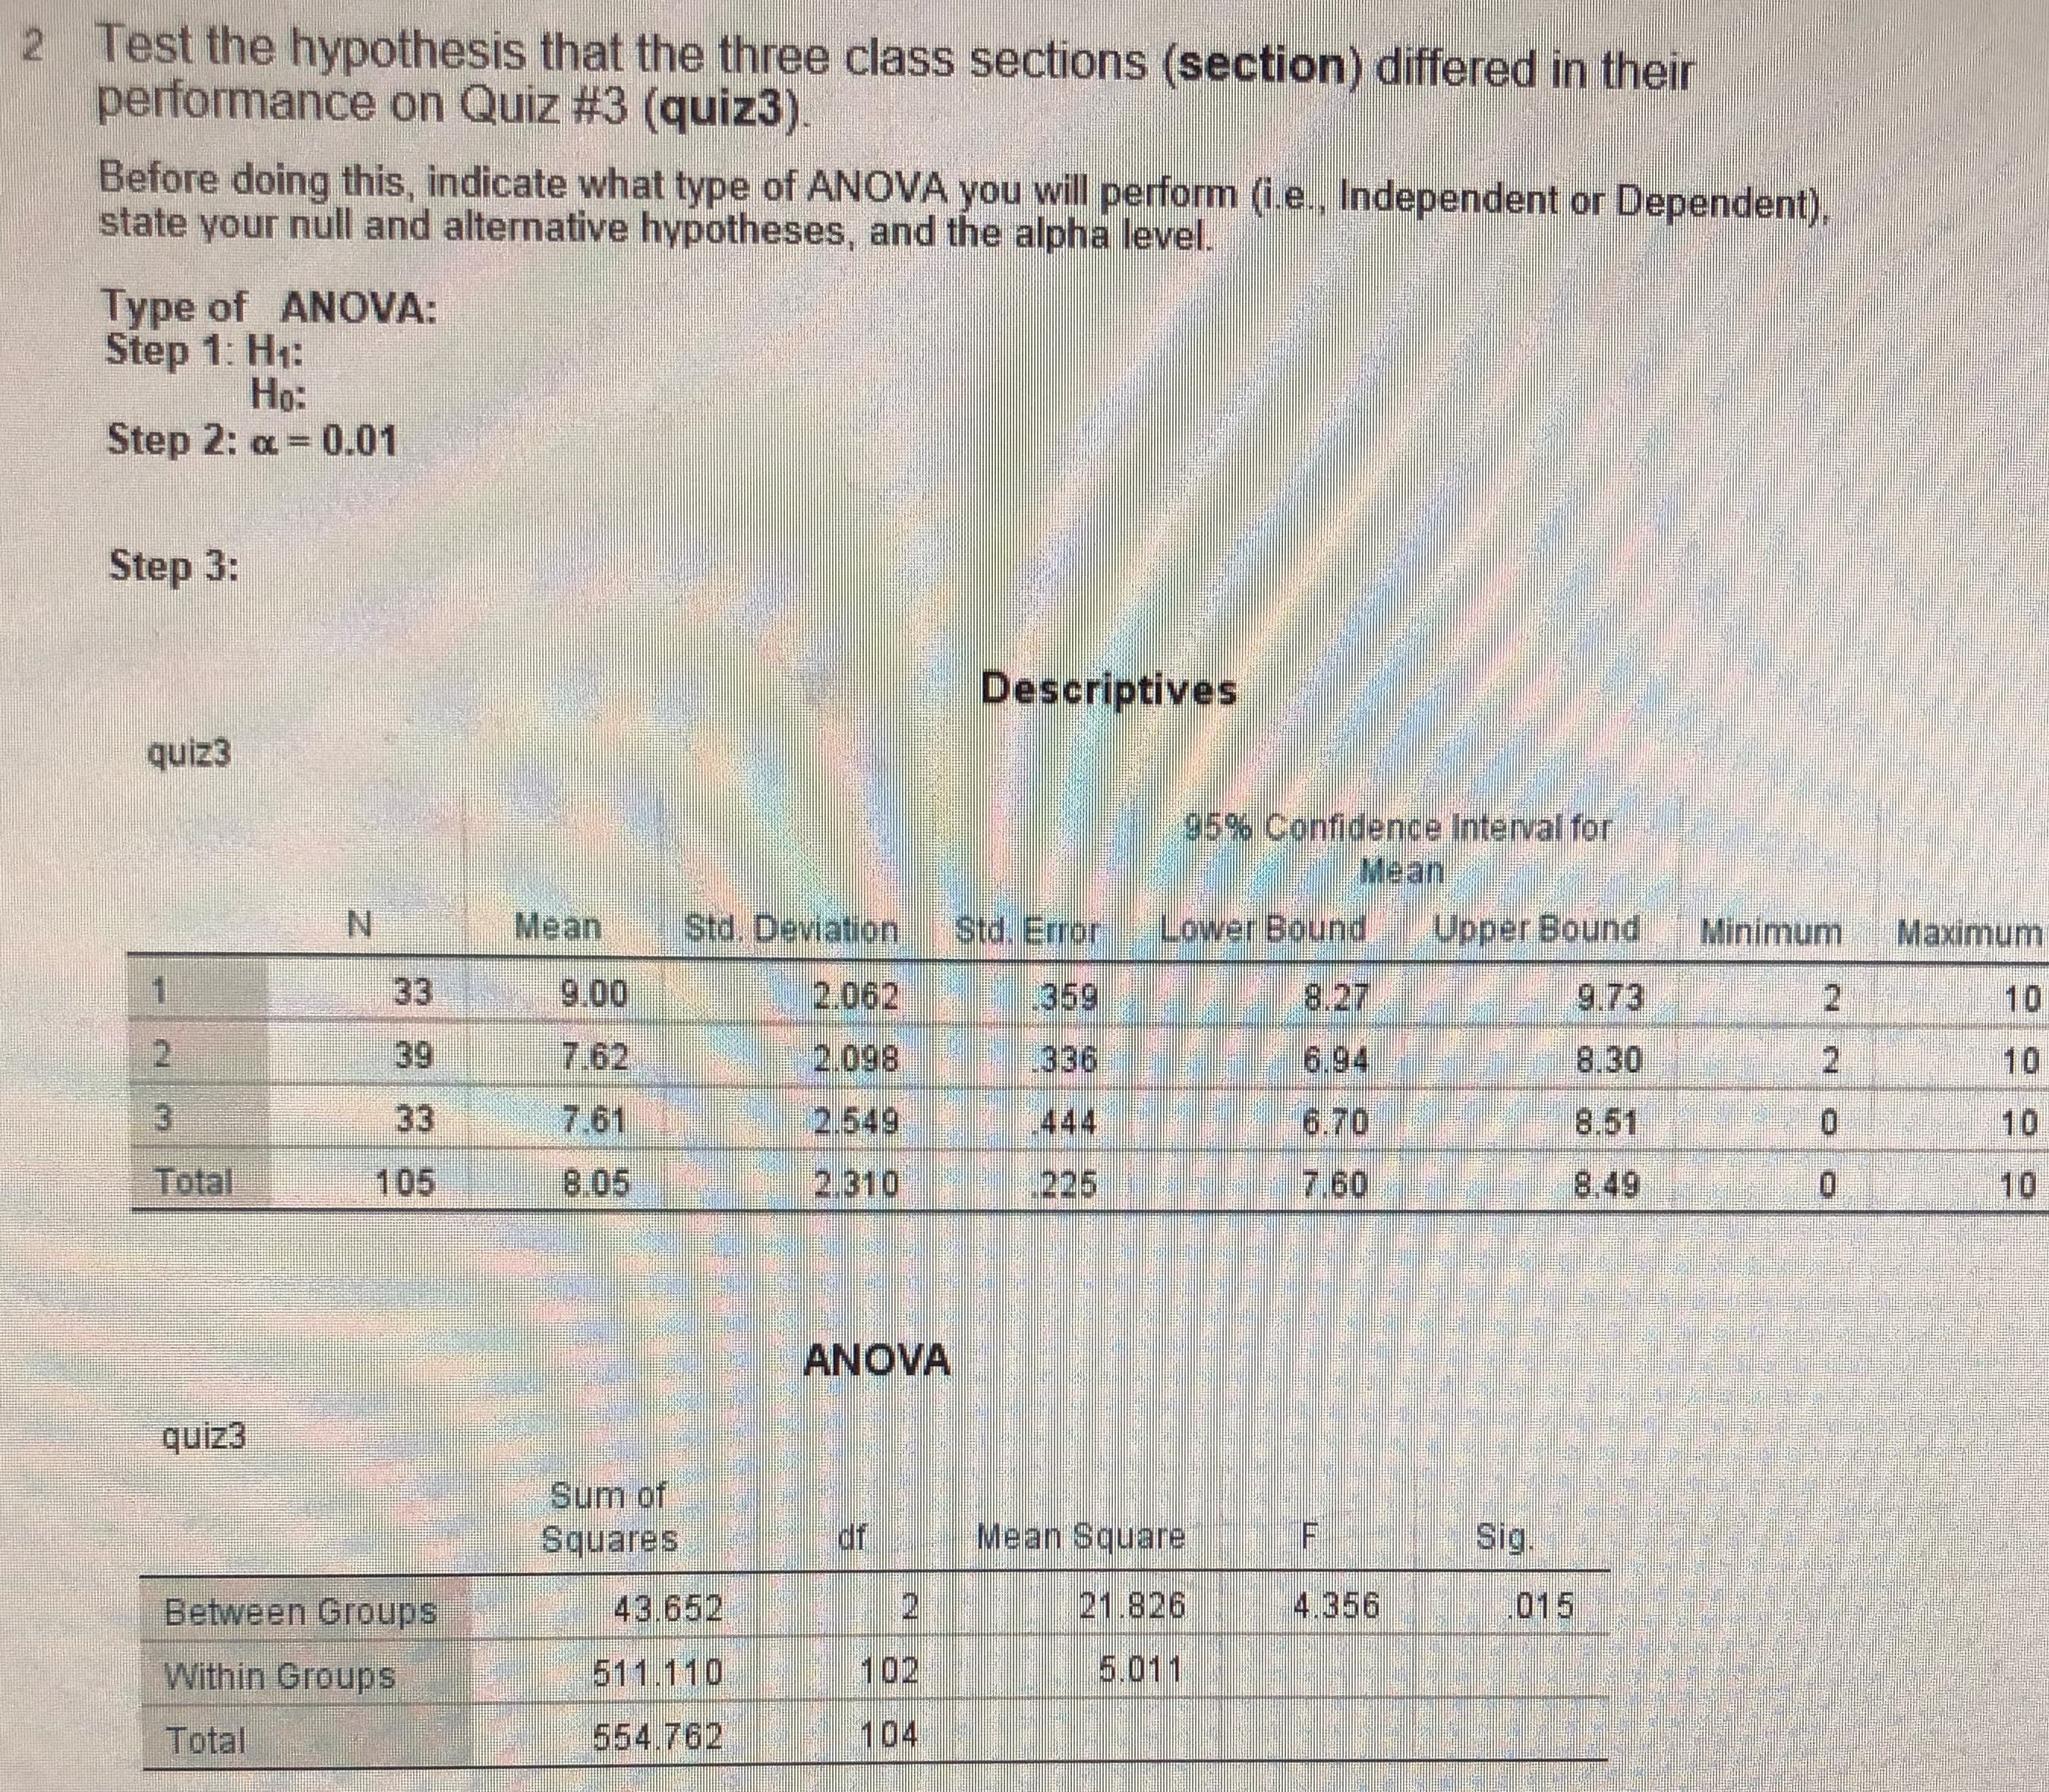
Transcribed Image Text:Test the hypothesis that the three class sections (section) differed in their
performance on Quiz #3 (quiz3).
2
Before doing this, indicate what type of ANOVA you will perform (i.e., Independent or Dependent),
state your null and alternative hypotheses, and the alpha level.
Type of ANOVA:
Step 1: H1:
Ho:
Step 2: a = 0.01
Step 3:
Descriptives
quiz3
95% Confidence Interval for
Mean
Mean
N.
Std. Deviation
Lower Bound
Upper Bound
Std. Error
Minimum
Maximum
33
9.00
2.062
9.73
8.27
359
10
7.62
39
2.098
6.94
336
8.30
10
33
7.61
2.549
6.70
1444
8.51
10
0.
Total
8.05
2.310
105
225
7.60
8,49
10
ANOVA
quiz3
Sum of
Squares
Mean Square
df
Sig
21.826
4.356
015
43.652
Between Groups
5.011
102
511.110
Within Groups
104
554.762
Total
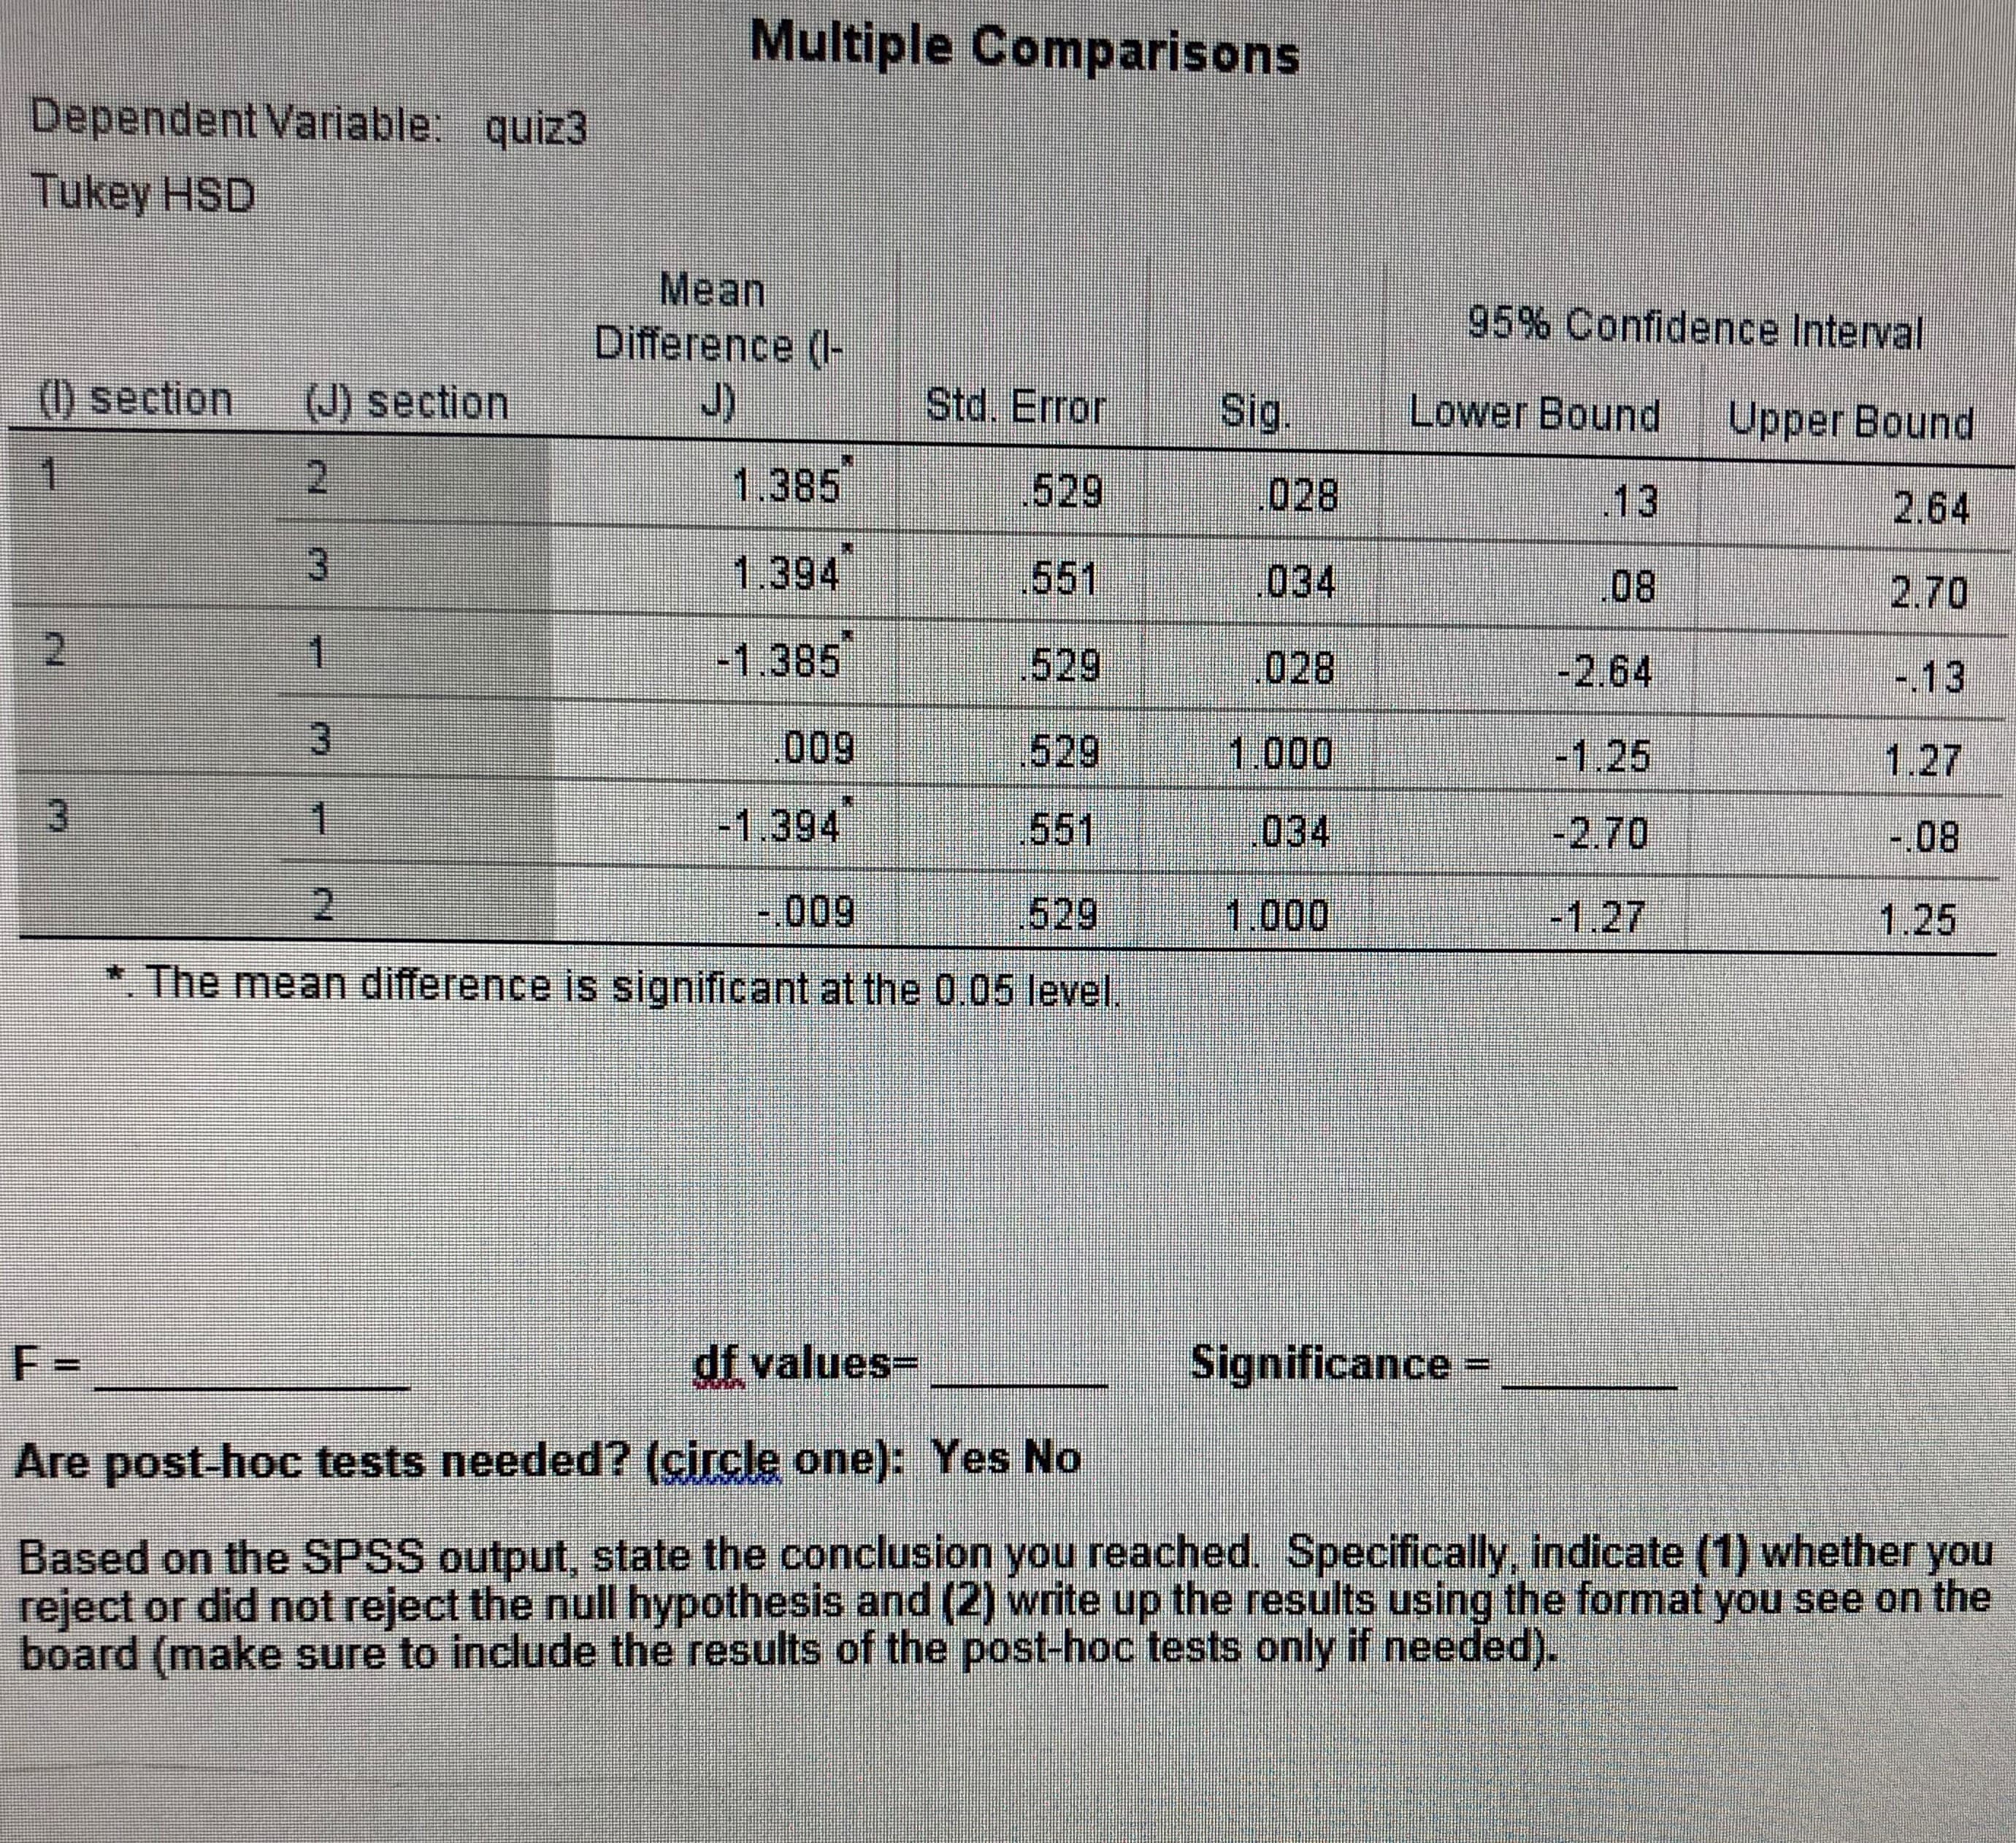
Transcribed Image Text:Multiple Comparisons
Dependent Variable: quiz3
Tukey HSD
Mean
Difference (l-
J)
95% Confidence Interval
) section
(J) section
Std. Error
Sig.
Lower Bound
Upper Bound
2.
1.
1.385
529
028
13
2.64
1.394
551
.034
08
2.70
2.
1
-1.385
.529
.028
-2.64
-.13
3.
009
529
1.000
-1.25
1.27
1
3)
-1.394
551
034
-2.70
-.08
2.
009
529
*. The mean difference is significant at the 0.05 level.
-1.27
1.000
1.25
df values-
Significance =
F=
%3D
Are post-hoc tests needed? (circle one): Yes No
Based on the SPSS output, state the conclusion you reached. Specifically, indicate (1) whether you
reject or did not reject the null hypothesis and (2) write up the results using the format you see on the
board (make sure to include the results of the post-hoc tests only if needed).
3.
Expert Solution
This question has been solved!
Explore an expertly crafted, step-by-step solution for a thorough understanding of key concepts.

This is a popular solution!

Trending now
This is a popular solution!

Step by step
Solved in 2 steps

Recommended textbooks for you
College Algebra (MindTap Course List)
Algebra
ISBN:
9781305652231
Author:
R. David Gustafson, Jeff Hughes
Publisher:
Cengage Learning
College Algebra (MindTap Course List)
Algebra
ISBN:
9781305652231
Author:
R. David Gustafson, Jeff Hughes
Publisher:
Cengage Learning