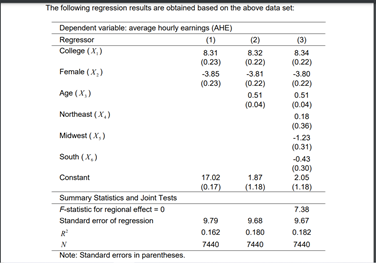
Do there appear to be important regional differences? Use an appropriate hypothesis test to explain your answer. b) Explain why the regressor West is omitted from the regression? c) Juanita is a 28-year-old female college graduate from the South. Molly is a 28-year-old female college graduate from the West. Jennifer is a 28-year-old female college graduate


a) Do there appear to be important regional differences? Use an appropriate hypothesis test to explain your answer.
b) Explain why the regressor West is omitted from the regression?
c) Juanita is a 28-year-old female college graduate from the South. Molly is a 28-year-old female college graduate from the West. Jennifer is a 28-year-old female college graduate from the Midwest.
(i) Construct a 95% confidence interval for the difference in expected earnings
between Juanita and Molly.
(ii) Explain how you would construct a 95% confidence interval for the difference in expected earnings between Juanita and Jennifer. (Hint: What would happen if you included West and excluded Midwest from the regression?)


Trending now
This is a popular solution!

Step by step
Solved in 5 steps with 1 images


