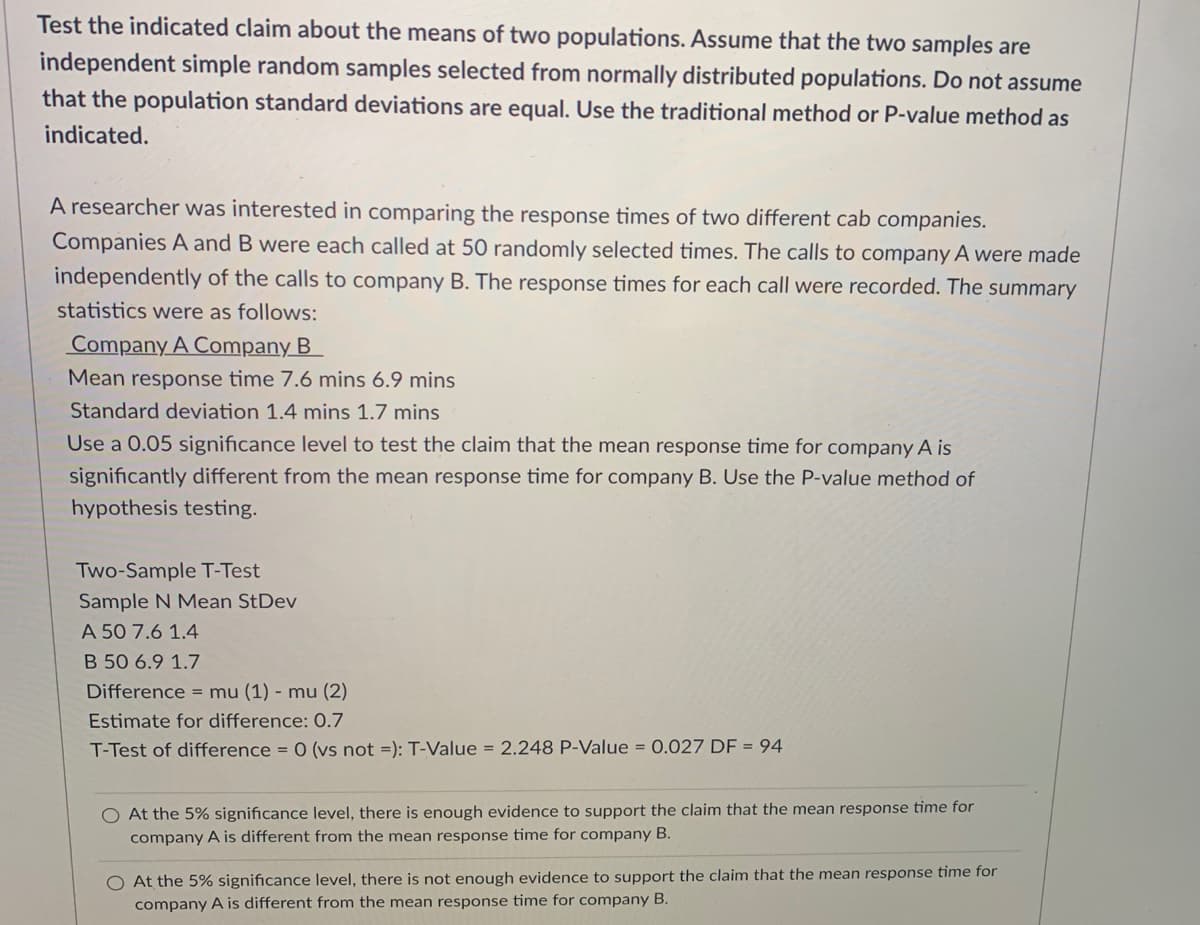
Test the indicated claim about the means of two populations. Assume that the two samples are independent simple random samples selected from normally distributed populations. Do not assume that the population standard deviations are equal. Use the traditional method or P-value method as indicated. A researcher was interested in comparing the response times of two different cab companies. Companies A and B were each called at 50 randomly selected times. The calls to company A were made independently of the calls to company B. The response times for each call were recorded. The summary statistics were as follows: Company A Company B_ Mean response time 7.6 mins 6.9 mins Standard deviation 1.4 mins 1.7 mins Use a 0.05 significance level to test the claim that the mean response time for company A is significantly different from the mean response time for company B. Use the P-value method of hypothesis testing. Two-Sample T-Test Sample N Mean StDev A 50 7.6 1.4 B 50 6.9 1.7 Difference = mu (1) - mu (2) Estimate for difference: 0.7 T-Test of difference = 0 (vs not =): T-Value = 2.248 P-Value = 0.027 DF = 94 O At the 5% significance level, there is enough evidence to support the claim that the mean response time for company A is different from the mean response time for company B. O At the 5% significance level, there is not enough evidence to support the claim that the mean response time for company A is different from the mean response time for company B.


Addition Rule of Probability
It simply refers to the likelihood of an event taking place whenever the occurrence of an event is uncertain. The probability of a single event can be calculated by dividing the number of successful trials of that event by the total number of trials.
Expected Value
When a large number of trials are performed for any random variable ‘X’, the predicted result is most likely the mean of all the outcomes for the random variable and it is known as expected value also known as expectation. The expected value, also known as the expectation, is denoted by: E(X).
Probability Distributions
Understanding probability is necessary to know the probability distributions. In statistics, probability is how the uncertainty of an event is measured. This event can be anything. The most common examples include tossing a coin, rolling a die, or choosing a card. Each of these events has multiple possibilities. Every such possibility is measured with the help of probability. To be more precise, the probability is used for calculating the occurrence of events that may or may not happen. Probability does not give sure results. Unless the probability of any event is 1, the different outcomes may or may not happen in real life, regardless of how less or how more their probability is.
Basic Probability
The simple definition of probability it is a chance of the occurrence of an event. It is defined in numerical form and the probability value is between 0 to 1. The probability value 0 indicates that there is no chance of that event occurring and the probability value 1 indicates that the event will occur. Sum of the probability value must be 1. The probability value is never a negative number. If it happens, then recheck the calculation.


Trending now
This is a popular solution!

Step by step
Solved in 2 steps


