tewart Fleishman specializes in the psychiatric aspects of symptom management in cancer patients. Pain, depression, and fatigue can appear as single symptoms, in conjunction with one other symptom, or all together in patients with cancer.
tewart Fleishman specializes in the psychiatric aspects of symptom management in cancer patients. Pain, depression, and fatigue can appear as single symptoms, in conjunction with one other symptom, or all together in patients with cancer.

MATLAB: An Introduction with Applications
6th Edition
ISBN:9781119256830
Author:Amos Gilat
Publisher:Amos Gilat
Chapter1: Starting With Matlab
Section: Chapter Questions
Problem 1P

Related questions
Question
100%
Stewart Fleishman specializes in the psychiatric aspects of symptom management in cancer patients. Pain, depression, and fatigue can appear as single symptoms, in conjunction with one other symptom, or all together in patients with cancer.
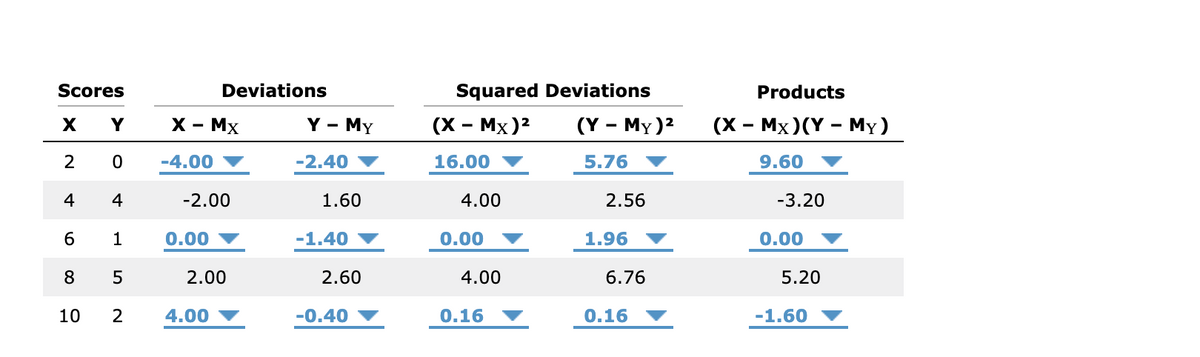
Transcribed Image Text:Scores
Deviations
Squared Deviations
Products
Y
X - Mx
Y - My
(х - Мx)2
(Y - My)2
(х — Мx)(Ү - My)
-4.00
-2.40
16.00
5.76
9.60
4
4
-2.00
1.60
4.00
2.56
-3.20
6.
1
0.00
-1.40
0.00
1.96
0.00
8
2.00
2.60
4.00
6.76
5.20
10
4.00
-0.40
0.16
0.16
-1.60
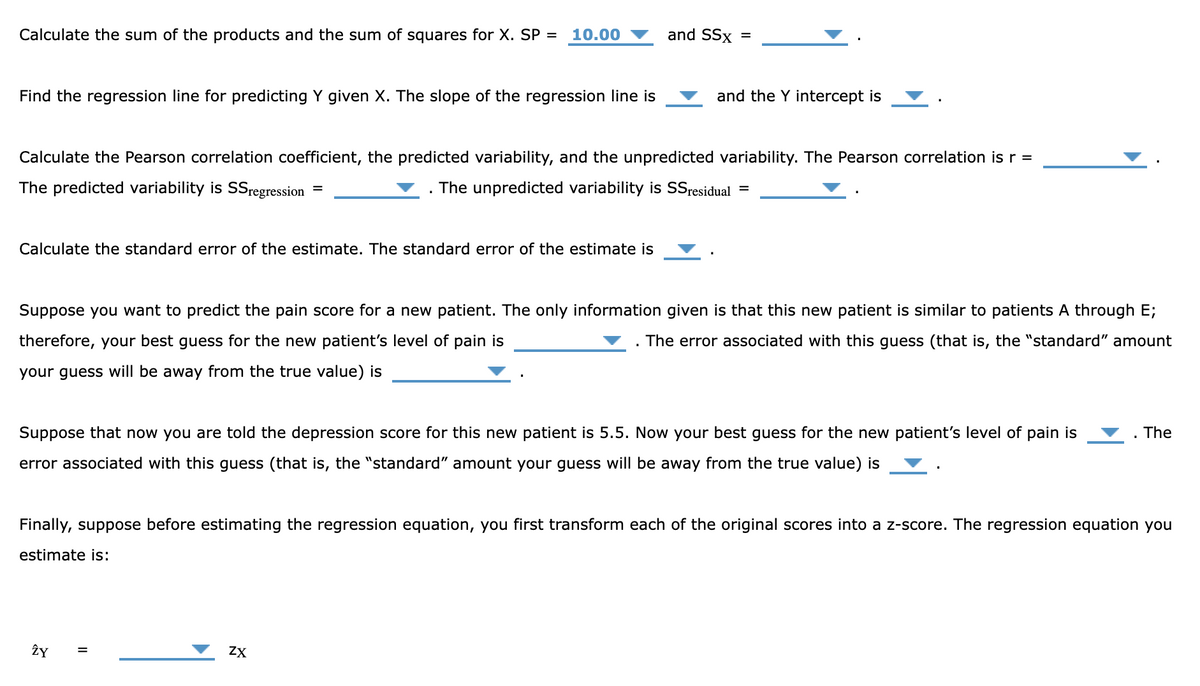
Transcribed Image Text:Calculate the sum of the products and the sum of squares for X. SP =
10.00
and SSx =
Find the regression line for predicting Y given X. The slope of the regression line is
and the Y intercept is
Calculate the Pearson correlation coefficient, the predicted variability, and the unpredicted variability. The Pearson correlation is r =
The predicted variability is SSregression
The unpredicted variability is SSresidual
%D
%D
Calculate the standard error of the estimate. The standard error of the estimate is
Suppose you want to predict the pain score for a new patient. The only information given is that this new patient is similar to patients A through E;
therefore, your best guess for the new patient's level of pain is
. The error associated with this guess (that is, the "standard" amount
your guess will be away from the true value) is
Suppose that now you are told the depression score for this new patient is 5.5. Now your best guess for the new patient's level of pain is
. The
error associated with this guess (that is, the "standard" amount your guess will be away from the true value) is
Finally, suppose before estimating the regression equation, you first transform each of the original scores into a z-score. The regression equation you
estimate is:
ŻY
ZX
Expert Solution
This question has been solved!
Explore an expertly crafted, step-by-step solution for a thorough understanding of key concepts.

Step by step
Solved in 3 steps with 4 images

Recommended textbooks for you
MATLAB: An Introduction with Applications
Statistics
ISBN:
9781119256830
Author:
Amos Gilat
Publisher:
John Wiley & Sons Inc

Probability and Statistics for Engineering and th…
Statistics
ISBN:
9781305251809
Author:
Jay L. Devore
Publisher:
Cengage Learning

Statistics for The Behavioral Sciences (MindTap C…
Statistics
ISBN:
9781305504912
Author:
Frederick J Gravetter, Larry B. Wallnau
Publisher:
Cengage Learning
MATLAB: An Introduction with Applications
Statistics
ISBN:
9781119256830
Author:
Amos Gilat
Publisher:
John Wiley & Sons Inc
Probability and Statistics for Engineering and th…
Statistics
ISBN:
9781305251809
Author:
Jay L. Devore
Publisher:
Cengage Learning
Statistics for The Behavioral Sciences (MindTap C…
Statistics
ISBN:
9781305504912
Author:
Frederick J Gravetter, Larry B. Wallnau
Publisher:
Cengage Learning

Elementary Statistics: Picturing the World (7th E…
Statistics
ISBN:
9780134683416
Author:
Ron Larson, Betsy Farber
Publisher:
PEARSON

The Basic Practice of Statistics
Statistics
ISBN:
9781319042578
Author:
David S. Moore, William I. Notz, Michael A. Fligner
Publisher:
W. H. Freeman

Introduction to the Practice of Statistics
Statistics
ISBN:
9781319013387
Author:
David S. Moore, George P. McCabe, Bruce A. Craig
Publisher:
W. H. Freeman