The 2002 general Social Survey asked a large number of people how much time they spent watching TV each day. The mean number of hours was 4.16 with a standard deviation of 2.23. Assume that in a sample of 52 teenagers, the sample standard deviation of daily TV time is 1.98 hours, and that the population of TV watching times is normally distributed. Under 10% significance level can you conclude that the population standard deviation of TV watching times for teenagers is different from 2.23? Procedure: Select an answer Assumption Select an answer O Popu O The One proportion Z Hypothesis Test ponses are both greater than 10 O Popu One variance x" Hypothesis Test O Simp O Norm One mean T Hypothesis Test O Samg One mean Z Hypothesis Test Step 1. Hypl
The 2002 general Social Survey asked a large number of people how much time they spent watching TV each day. The mean number of hours was 4.16 with a standard deviation of 2.23. Assume that in a sample of 52 teenagers, the sample standard deviation of daily TV time is 1.98 hours, and that the population of TV watching times is normally distributed. Under 10% significance level can you conclude that the population standard deviation of TV watching times for teenagers is different from 2.23? Procedure: Select an answer Assumption Select an answer O Popu O The One proportion Z Hypothesis Test ponses are both greater than 10 O Popu One variance x" Hypothesis Test O Simp O Norm One mean T Hypothesis Test O Samg One mean Z Hypothesis Test Step 1. Hypl

MATLAB: An Introduction with Applications
6th Edition
ISBN:9781119256830
Author:Amos Gilat
Publisher:Amos Gilat
Chapter1: Starting With Matlab
Section: Chapter Questions
Problem 1P

Related questions

Topic Video
Question
For the procedure, the options are on the second screenshot.
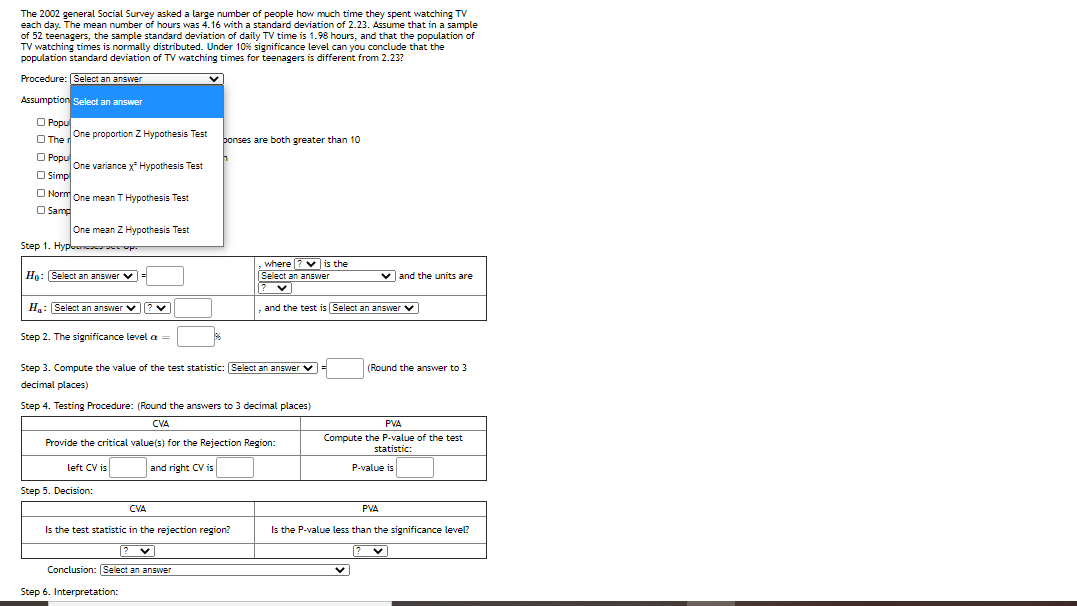
Transcribed Image Text:The 2002 general Social Survey asked a large number of people how much time they spent watching TV
each day. The mean number of hours was 4.16 with a standard deviation of 2.23. Assume that in a sample
of 52 teenagers, the sample standard deviation of daily TV time is 1.98 hours, and that the population of
TV watching times is normally distributed. Under 10% significance level can you conclude that the
population standard deviation of TV watching times for teenagers is different from 2.23?
Procedure: Select an answer
Assumption Select an answer
O Popu
O The One proportion Z Hypothesis Test
bonses are both greater than 10
O Popu
One variance x Hypothesis Test
O Simp
O Norm One mean T Hypothesis Test
O Samd
One mean Z Hypothesis Test
Step 1. Hypue op
where ? v is the
Hp: Select an answer v =
Select an answer
vand the units are
? v
Ha: Select an answer v?v
and the test is Select an answer v
Step 2. The significance level a =
Step 3. Compute the value of the test statistic: Select an answer v
(Round the answer to 3
decimal places)
Step 4. Testing Procedure: (Round the answers to 3 decimal places)
CVA
PVA
Compute the P-value of the test
statistic:
Provide the critical value(s) for the Rejection Region:
left CV is
and right CV is
P-value is
Step 5. Decision:
CVA
PVA
Is the test statistic in the rejection region?
Is the P-value less than the significance level?
Conclusion: Select an answer
Step 6. Interpretation:
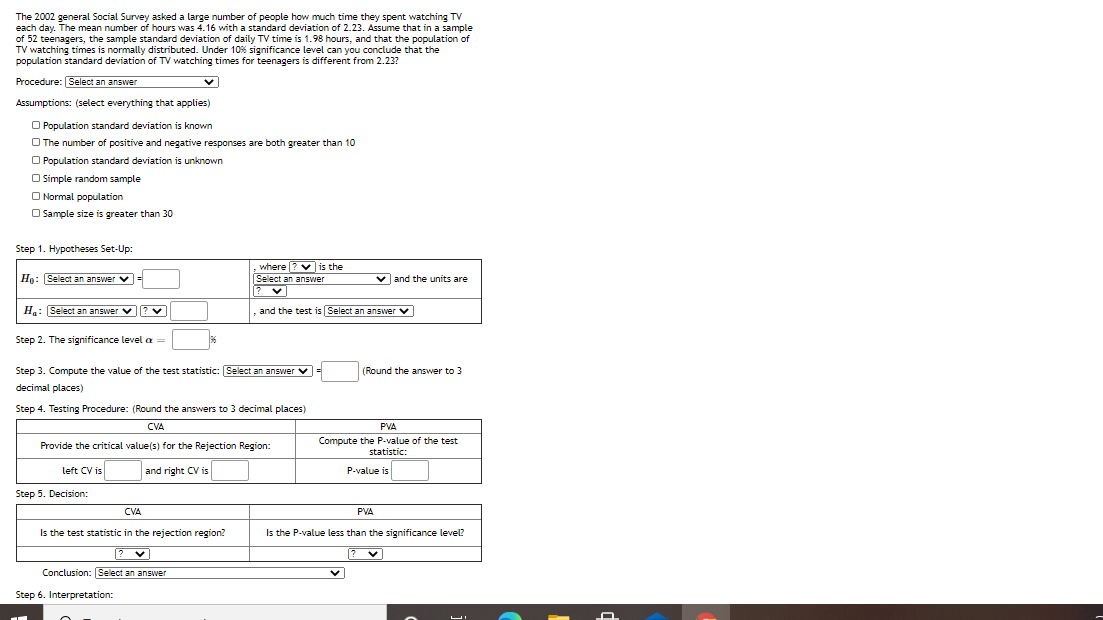
Transcribed Image Text:The 2002 general Social Survey asked a large number of people how much time they spent watching TV
each day. The mean number of hours was 4.16 with a standard deviation of 2.23. Assume that in a sample
of 52 teenagers, the sample standard deviation of daily TV time is 1.98 hours, and that the population of
TV watching times is normally distributed. Under 10% significance level can you conclude that the
population standard deviation of TV watching times for teenagers is different from 2.23?
Procedure: Select an answer
Assumptions: (select everything that applies)
O Population standard deviation is known
O The number of positive and negative responses are both greater than 10
O Population standard deviation is unknown
O Simple random sample
O Normal population
O Sample size is greater than 30
Step 1. Hypotheses Set-Up:
where ? v is the
Select an answer
Họ: Select an answer v=
vand the units are
H: [Select an answer v
and the test is Select an answer v
Step 2. The significance level a =
56
Step 3. Compute the value of the test statistic: Select an answer v=
(Round the answer to 3
decimal places)
Step 4. Testing Procedure: (Round the answers to 3 decimal places)
CVA
PVA
Compute the P.value of the test
Provide the critical value(s) for the Rejection Region:
statistic:
:
left CV is
and right CV is
P-value is
Step 5. Decision:
CVA
PVA
Is the test statistic in the rejection region?
Is the P-value less than the significance level?
Conclusion: [Select an answer
Step 6. Interpretation:
Expert Solution
This question has been solved!
Explore an expertly crafted, step-by-step solution for a thorough understanding of key concepts.

This is a popular solution!

Trending now
This is a popular solution!

Step by step
Solved in 3 steps

Knowledge Booster


Learn more about
Need a deep-dive on the concept behind this application? Look no further. Learn more about this topic, statistics and related others by exploring similar questions and additional content below.Recommended textbooks for you
MATLAB: An Introduction with Applications
Statistics
ISBN:
9781119256830
Author:
Amos Gilat
Publisher:
John Wiley & Sons Inc

Probability and Statistics for Engineering and th…
Statistics
ISBN:
9781305251809
Author:
Jay L. Devore
Publisher:
Cengage Learning

Statistics for The Behavioral Sciences (MindTap C…
Statistics
ISBN:
9781305504912
Author:
Frederick J Gravetter, Larry B. Wallnau
Publisher:
Cengage Learning
MATLAB: An Introduction with Applications
Statistics
ISBN:
9781119256830
Author:
Amos Gilat
Publisher:
John Wiley & Sons Inc
Probability and Statistics for Engineering and th…
Statistics
ISBN:
9781305251809
Author:
Jay L. Devore
Publisher:
Cengage Learning
Statistics for The Behavioral Sciences (MindTap C…
Statistics
ISBN:
9781305504912
Author:
Frederick J Gravetter, Larry B. Wallnau
Publisher:
Cengage Learning

Elementary Statistics: Picturing the World (7th E…
Statistics
ISBN:
9780134683416
Author:
Ron Larson, Betsy Farber
Publisher:
PEARSON

The Basic Practice of Statistics
Statistics
ISBN:
9781319042578
Author:
David S. Moore, William I. Notz, Michael A. Fligner
Publisher:
W. H. Freeman

Introduction to the Practice of Statistics
Statistics
ISBN:
9781319013387
Author:
David S. Moore, George P. McCabe, Bruce A. Craig
Publisher:
W. H. Freeman