Thẻ accompanying data are the number of wins and the earned run averages (mean number of earned runs allowed per nine innings pitched) for eight baseball pitchers in a rece the equation of the regression line. Then construct a scatter plot of the data and draw the regression line. Then use the regression equation to predict the value of y for each of the if meaningful. If the x-value is not meaningful to predict the value of y, explain why not. (a) x =5 wins E Click the icon to view the table of numbers of wins and earned run average. (b) x= 10 wins (c) x = 19 wins (d) x = 15 wins The equation of the regression line is y = 6.58 x+|0.20. (Round to two decimal places as needed.)
Thẻ accompanying data are the number of wins and the earned run averages (mean number of earned runs allowed per nine innings pitched) for eight baseball pitchers in a rece the equation of the regression line. Then construct a scatter plot of the data and draw the regression line. Then use the regression equation to predict the value of y for each of the if meaningful. If the x-value is not meaningful to predict the value of y, explain why not. (a) x =5 wins E Click the icon to view the table of numbers of wins and earned run average. (b) x= 10 wins (c) x = 19 wins (d) x = 15 wins The equation of the regression line is y = 6.58 x+|0.20. (Round to two decimal places as needed.)

College Algebra (MindTap Course List)
12th Edition
ISBN:9781305652231
Author:R. David Gustafson, Jeff Hughes
Publisher:R. David Gustafson, Jeff Hughes
Chapter8: Sequences, Series, And Probability
Section8.6: Permutations And Combinations
Problem 37E

Related questions

Topic Video
Question
Can you please check my work
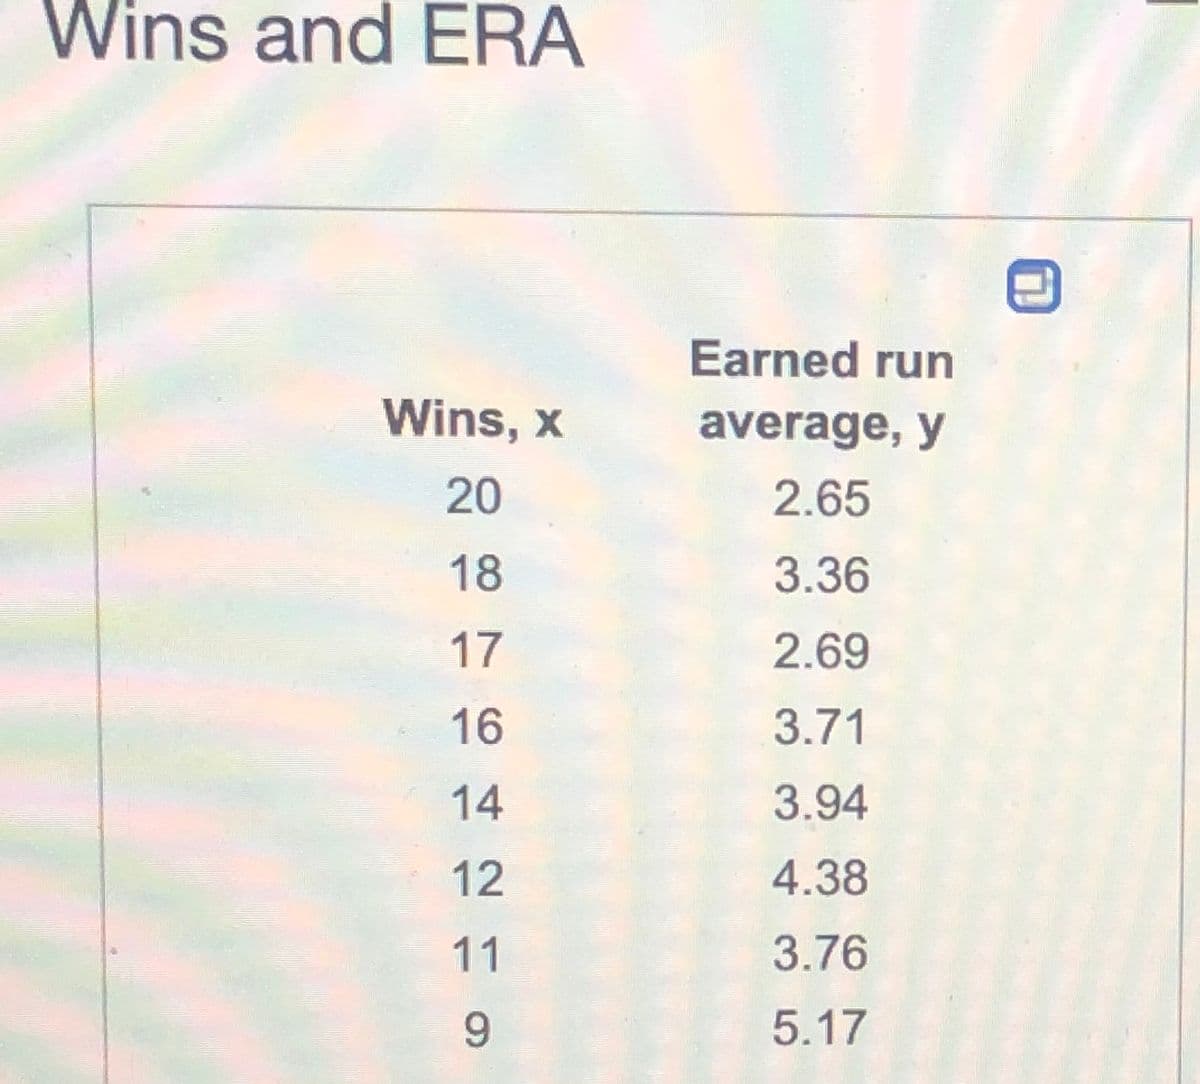
Transcribed Image Text:Wins and ERA
Earned run
Wins, x
average, y
20
2.65
18
3.36
17
2.69
16
3.71
14
3.94
12
4.38
11
3.76
9.
5.17
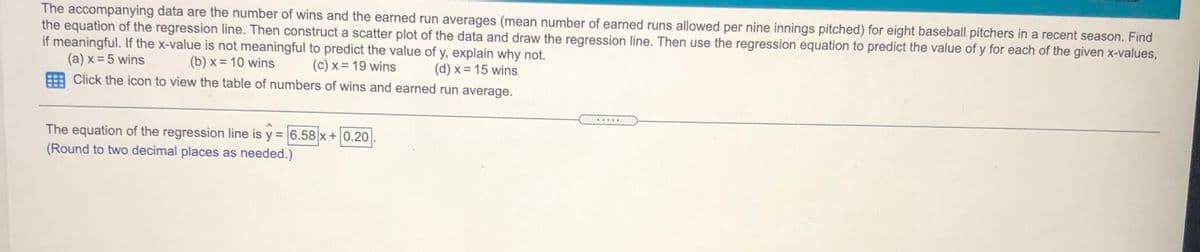
Transcribed Image Text:The accompanying data are the number of wins and the earned run averages (mean number of earned runs allowed per nine innings pitched) for eight baseball pitchers in a recent season. Find
the equation of the regression line. Then construct a scatter plot of the data and draw the regression line. Then use the regression equation to predict the value of y for each of the given x-values,
if meaningful. If the x-value is not meaningful to predict the value of y, explain why not.
(a) x = 5 wins
(b) x = 10 wins
(c) x = 19 wins
(d) x = 15 wins
Click the icon to view the table of numbers of wins and earned run average.
.....
The equation of the regression line is y = 6.58 x+0.20
(Round to two decimal places as needed.)
Expert Solution
This question has been solved!
Explore an expertly crafted, step-by-step solution for a thorough understanding of key concepts.

This is a popular solution!

Trending now
This is a popular solution!

Step by step
Solved in 4 steps with 2 images

Knowledge Booster


Learn more about
Need a deep-dive on the concept behind this application? Look no further. Learn more about this topic, statistics and related others by exploring similar questions and additional content below.Recommended textbooks for you
College Algebra (MindTap Course List)
Algebra
ISBN:
9781305652231
Author:
R. David Gustafson, Jeff Hughes
Publisher:
Cengage Learning

Algebra & Trigonometry with Analytic Geometry
Algebra
ISBN:
9781133382119
Author:
Swokowski
Publisher:
Cengage

Glencoe Algebra 1, Student Edition, 9780079039897…
Algebra
ISBN:
9780079039897
Author:
Carter
Publisher:
McGraw Hill
College Algebra (MindTap Course List)
Algebra
ISBN:
9781305652231
Author:
R. David Gustafson, Jeff Hughes
Publisher:
Cengage Learning
Algebra & Trigonometry with Analytic Geometry
Algebra
ISBN:
9781133382119
Author:
Swokowski
Publisher:
Cengage
Glencoe Algebra 1, Student Edition, 9780079039897…
Algebra
ISBN:
9780079039897
Author:
Carter
Publisher:
McGraw Hill

College Algebra
Algebra
ISBN:
9781305115545
Author:
James Stewart, Lothar Redlin, Saleem Watson
Publisher:
Cengage Learning

Holt Mcdougal Larson Pre-algebra: Student Edition…
Algebra
ISBN:
9780547587776
Author:
HOLT MCDOUGAL
Publisher:
HOLT MCDOUGAL
