The accompanying data represent the weights of various domestic cars and their gas mileages in the city The linear correlation coefficient between the weight of a car and its miles per gallon in the city is r= - 0979 The least-squares regression line treating weight as the explanatory variable and miles per gallon as the response variable is y = -0.0066x+ 43.3079. Complete parts (a) and (b) below. E Click the icon to view the data table. (a) What proportion of the variability in miles per gallon is explained by the relation between weight of the car and miles per gallon? The proportion of the variability in miles per gallon explained by the relation between weight of the car and miles per gallon is %. (Round to one decimal place as needed.) (b) Interpret the coefficient of determination. % of the variance in V is by the linear model. (Round to one decimal place as needed.)
The accompanying data represent the weights of various domestic cars and their gas mileages in the city The linear correlation coefficient between the weight of a car and its miles per gallon in the city is r= - 0979 The least-squares regression line treating weight as the explanatory variable and miles per gallon as the response variable is y = -0.0066x+ 43.3079. Complete parts (a) and (b) below. E Click the icon to view the data table. (a) What proportion of the variability in miles per gallon is explained by the relation between weight of the car and miles per gallon? The proportion of the variability in miles per gallon explained by the relation between weight of the car and miles per gallon is %. (Round to one decimal place as needed.) (b) Interpret the coefficient of determination. % of the variance in V is by the linear model. (Round to one decimal place as needed.)

Glencoe Algebra 1, Student Edition, 9780079039897, 0079039898, 2018
18th Edition
ISBN:9780079039897
Author:Carter
Publisher:Carter
Chapter4: Equations Of Linear Functions
Section4.5: Correlation And Causation
Problem 2AGP

Related questions
Question
Transcribed Image Text:(d) Perfect negative
linear.corelation
60--1
(g) No linear correlation
(linearly uncorrelated)
Sep 5-3:11 PM
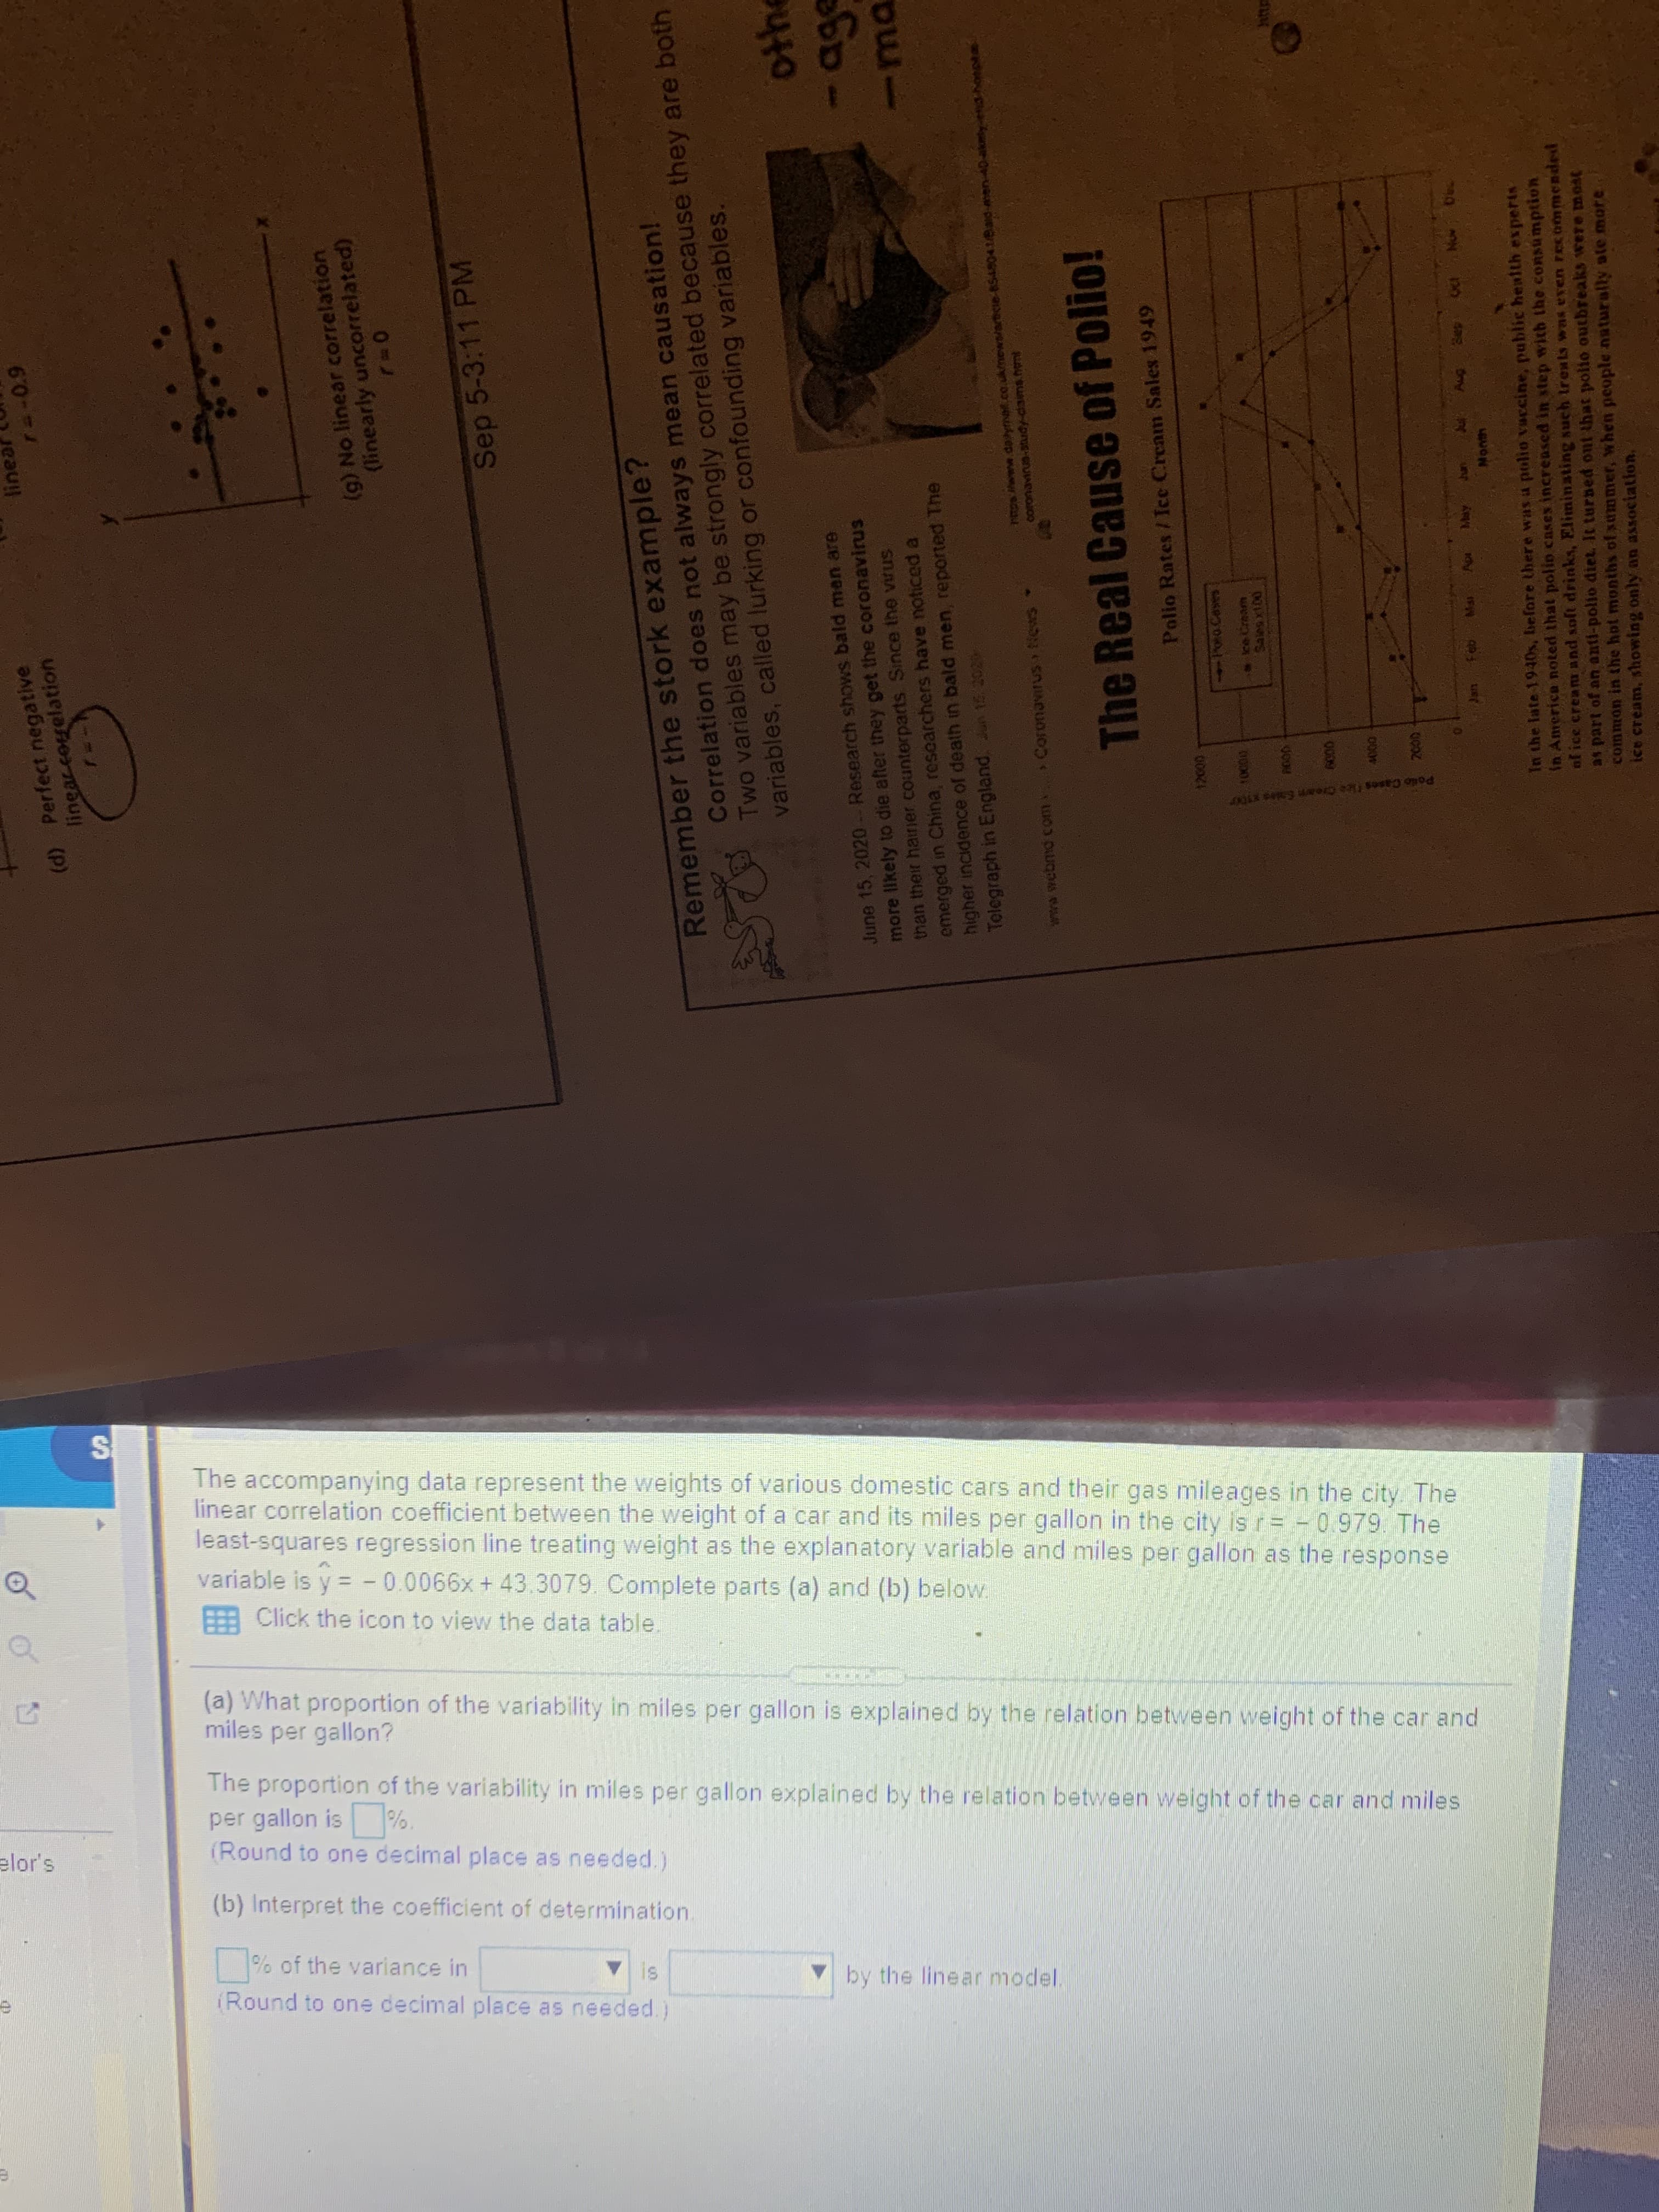
Remember the stork example?
Correlation does not always mean causation!
Two variables may be strongly correlated because they are both
variables, called lurking or confounding variables.
June 15, 2020-- Research shows bald men are
more llkely to die after they get the coronavirus
than their hairier counterparts Since the vtus
emerged in China, researchers have noticed a
higher incidence of death
Telegraph in England. Jn 15 2020
-age
bald men reported The
-ma
>Coronavirus ticws
Pta wwe.datymat.co.uknews/articie-854804.
Coronavina-study-daims.nomt
The Real Cause of Polio!
Polio Rates / Ice Cream Sales 1949
0000
ke Creamm
Nonth
In the late 1940s, before there was a polio vaccine, public health experts
In America noted that polio cases increased in step with the consumption
of ice cream and soft drinks, Eliminating such treats was even recommended
as part of an anti-polio diet. It turned ont that polio outbreaks were m.ost
common in the hot months of xummer, when people naturally ate more
ice cream, showing only an association.
Pollo Cases ee Cream Saes x
The accompanying data represent the weights of various domestic cars and their gas mileages in the city The
linear correlation coefficient between the weight of a car and its miles per gallon in the city is r= - 0979 The
least-squares regression line treating weight as the explanatory variable and miles per gallon as the response
variable is y = - 0.0066x + 43 3079. Complete parts (a) and (b) below
E Click the icon to view the data table.
of
of
(a) What proportion of the variability in miles per gallon is explained by the relation between weight of the car and
miles
per gallon?
The proportion of the variability in miles per gallon explained by the relation between weight of the car and miles
per gallon is%.
(Round to one decimal place as needed.)
elor's
(b) Interpret the coefficient of determination.
% of the variance in
V by the linear model.
(Round to one decimal place as needed.)
Expert Solution
This question has been solved!
Explore an expertly crafted, step-by-step solution for a thorough understanding of key concepts.

This is a popular solution!

Trending now
This is a popular solution!

Step by step
Solved in 2 steps

Recommended textbooks for you
Glencoe Algebra 1, Student Edition, 9780079039897…
Algebra
ISBN:
9780079039897
Author:
Carter
Publisher:
McGraw Hill

Big Ideas Math A Bridge To Success Algebra 1: Stu…
Algebra
ISBN:
9781680331141
Author:
HOUGHTON MIFFLIN HARCOURT
Publisher:
Houghton Mifflin Harcourt
Glencoe Algebra 1, Student Edition, 9780079039897…
Algebra
ISBN:
9780079039897
Author:
Carter
Publisher:
McGraw Hill
Big Ideas Math A Bridge To Success Algebra 1: Stu…
Algebra
ISBN:
9781680331141
Author:
HOUGHTON MIFFLIN HARCOURT
Publisher:
Houghton Mifflin Harcourt