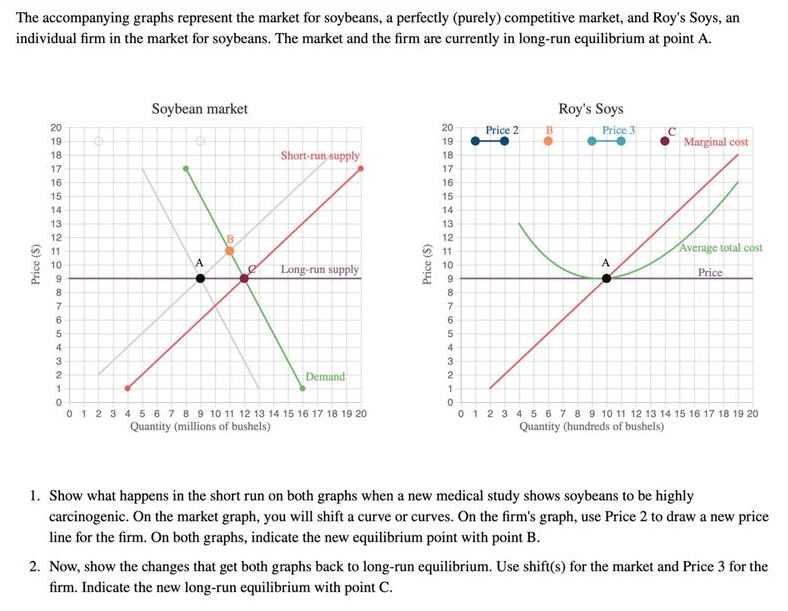
The accompanying graphs represent the market for soybeans, a perfectly (purely) competitive market, and Roy's Soys, an individual firm in the market for soybeans. The market and the firm are currently in long-run equilibrium at point A. Soybean market Roy's Soys 20 20 Price 2 B. Price 3 19 19 Marginal cost 18 Short-run supply 18 17 17 16 16 15 15 14 14 13 13 12 12 * 11 * 11 Average total cost 10 A 10 A Long-run supply Price 8. 8. 7 6. 6. 3 2 Demand 2 0 1 2 3 4 5 6 7 8 9 10 11 12 13 14 15 16 17 18 19 20 Quantity (millions of bushels) 0 1 2 3 4 5 6 7 8 9 10 11 12 13 14 15 16 17 18 19 20 Quantity (hundreds of bushels) 1. Show what happens in the short run on both graphs when a new medical study shows soybeans to be highly carcinogenic. On the market graph, you will shift a curve or curves. On the firm's graph, use Price 2 to draw a new price line for the firm. On both graphs, indicate the new equilibrium point with point B. 2. Now, show the changes that get both graphs back to long-run equilibrium. Use shift(s) for the market and Price 3 for the firm. Indicate the new long-run equilibrium with point C. Price ($)
The accompanying graphs represent the market for soybeans, a perfectly (purely) competitive market, and Roy's Soys, an individual firm in the market for soybeans. The market and the firm are currently in long-run equilibrium at point A. Soybean market Roy's Soys 20 20 Price 2 B. Price 3 19 19 Marginal cost 18 Short-run supply 18 17 17 16 16 15 15 14 14 13 13 12 12 * 11 * 11 Average total cost 10 A 10 A Long-run supply Price 8. 8. 7 6. 6. 3 2 Demand 2 0 1 2 3 4 5 6 7 8 9 10 11 12 13 14 15 16 17 18 19 20 Quantity (millions of bushels) 0 1 2 3 4 5 6 7 8 9 10 11 12 13 14 15 16 17 18 19 20 Quantity (hundreds of bushels) 1. Show what happens in the short run on both graphs when a new medical study shows soybeans to be highly carcinogenic. On the market graph, you will shift a curve or curves. On the firm's graph, use Price 2 to draw a new price line for the firm. On both graphs, indicate the new equilibrium point with point B. 2. Now, show the changes that get both graphs back to long-run equilibrium. Use shift(s) for the market and Price 3 for the firm. Indicate the new long-run equilibrium with point C. Price ($)

Microeconomics: Private and Public Choice (MindTap Course List)
16th Edition
ISBN:9781305506893
Author:James D. Gwartney, Richard L. Stroup, Russell S. Sobel, David A. Macpherson
Publisher:James D. Gwartney, Richard L. Stroup, Russell S. Sobel, David A. Macpherson
Chapter10: Price-searcher Markets With Low Entry Barriers
Section: Chapter Questions
Problem 15CQ

Related questions
Question
Transcribed Image Text:The accompanying graphs represent the market for soybeans, a perfectly (purely) competitive market, and Roy's Soys, an
individual firm in the market for soybeans. The market and the firm are currently in long-run equilibrium at point A.
Soybean market
Roy's Soys
20
20
Price 2
B.
Price 3
19
19
Marginal cost
18
Short-run supply
18
17
17
16
16
15
15
14
14
13
13
12
12
* 11
* 11
Average total cost
10
A
10
A
Long-run supply
Price
8.
8.
7
6.
6.
3
2
Demand
2
0 1 2 3 4 5 6 7 8 9 10 11 12 13 14 15 16 17 18 19 20
Quantity (millions of bushels)
0 1 2 3 4 5 6 7 8 9 10 11 12 13 14 15 16 17 18 19 20
Quantity (hundreds of bushels)
1. Show what happens in the short run on both graphs when a new medical study shows soybeans to be highly
carcinogenic. On the market graph, you will shift a curve or curves. On the firm's graph, use Price 2 to draw a new price
line for the firm. On both graphs, indicate the new equilibrium point with point B.
2. Now, show the changes that get both graphs back to long-run equilibrium. Use shift(s) for the market and Price 3 for the
firm. Indicate the new long-run equilibrium with point C.
Price ($)
Expert Solution
This question has been solved!
Explore an expertly crafted, step-by-step solution for a thorough understanding of key concepts.

This is a popular solution!

Trending now
This is a popular solution!

Step by step
Solved in 2 steps with 1 images

Recommended textbooks for you
Microeconomics: Private and Public Choice (MindTa…
Economics
ISBN:
9781305506893
Author:
James D. Gwartney, Richard L. Stroup, Russell S. Sobel, David A. Macpherson
Publisher:
Cengage Learning

Economics: Private and Public Choice (MindTap Cou…
Economics
ISBN:
9781305506725
Author:
James D. Gwartney, Richard L. Stroup, Russell S. Sobel, David A. Macpherson
Publisher:
Cengage Learning
Microeconomics: Private and Public Choice (MindTa…
Economics
ISBN:
9781305506893
Author:
James D. Gwartney, Richard L. Stroup, Russell S. Sobel, David A. Macpherson
Publisher:
Cengage Learning
Economics: Private and Public Choice (MindTap Cou…
Economics
ISBN:
9781305506725
Author:
James D. Gwartney, Richard L. Stroup, Russell S. Sobel, David A. Macpherson
Publisher:
Cengage Learning