The accompanying table shows the height (in inches) of 8 high school giris and their scores on an IQ test. Complete parts (a) through (d) below. Click here to view the data table. Click here to view the table of critical values for the Pearson comrelation coefficient (a) Display the data in a scatter plot. Choose the correct graph below. OA OB. Oc. 130 130 120 120 110- 100 sot so Height inches) Height ndhes) Height nches He ndhes (b) Calculate the sample correlation coeficientr. (Round to three decimal places as needed.) (c) Describe the type of correlation, if any, and interpret the correlation in the context of the data. There is inear corelation. Interpret the comelation. Choose the correct answer below. OA As high school girts' heights increase, their 1Q scores tend to decrease. OB. As high school girts' heights increase, their 1Q scores tend to increase. OC. Based on the corelation, there does not appear to be a linear relationship between high school giris' heights and their IQ scores. OD. Based on the comelation, there does not appear to be any relationship between high school giris' heights and their 1Q scores. OE Increases in high school giris' heights cause their la scores to decrease. OF. Increases in high school girls' heights cause their IQ scores to increase. (d) Use the table of critical values for the Pearson correlation coefficient to make a conclusion about the corelation coefficient. Let a0.01. The critical value is O Therefore, there V sufficient evidence at the 1% level of significance to conclude that Vbetween high school girts' heights and their 1Q scores . (Round to three decimal places as needed.) there is no comelation there is a significant linear corelation Critical Values for the Pearson Correlation Coefficient Data Table Height, x IQ score, y Critical Values for the Pearson Corelation Coefficient 62 106 58 97 64 102 67 112 The correlation is significant when the absolute value of is greater than the value in the table. 59 92 65 105 -005a– 0.01 66 55 114 0.950 0.990 0.959 0.917 0.960 123 0.878 0.875 0.834 0.798 0.765 0.735 0.708 0.684 0.661 0.641 0.623 0.606 0.590 0.754 0.707 0.666 0.632 Print Done 10 11 12 13 0.002 0576 0.553 0.532 0.514 0.497 0.482 0.468 14 15 16 17 18 19 0.456 0.575 20 21 22 0.444 0.433 0423 0.561 0.549 0.537 23 0.413 0.404 0.396 0.388 0.381 0374 0.367 0.526 24 26 27 28 29 0.505 0.496 0.487 0.479 0.471 0463
The accompanying table shows the height (in inches) of 8 high school giris and their scores on an IQ test. Complete parts (a) through (d) below. Click here to view the data table. Click here to view the table of critical values for the Pearson comrelation coefficient (a) Display the data in a scatter plot. Choose the correct graph below. OA OB. Oc. 130 130 120 120 110- 100 sot so Height inches) Height ndhes) Height nches He ndhes (b) Calculate the sample correlation coeficientr. (Round to three decimal places as needed.) (c) Describe the type of correlation, if any, and interpret the correlation in the context of the data. There is inear corelation. Interpret the comelation. Choose the correct answer below. OA As high school girts' heights increase, their 1Q scores tend to decrease. OB. As high school girts' heights increase, their 1Q scores tend to increase. OC. Based on the corelation, there does not appear to be a linear relationship between high school giris' heights and their IQ scores. OD. Based on the comelation, there does not appear to be any relationship between high school giris' heights and their 1Q scores. OE Increases in high school giris' heights cause their la scores to decrease. OF. Increases in high school girls' heights cause their IQ scores to increase. (d) Use the table of critical values for the Pearson correlation coefficient to make a conclusion about the corelation coefficient. Let a0.01. The critical value is O Therefore, there V sufficient evidence at the 1% level of significance to conclude that Vbetween high school girts' heights and their 1Q scores . (Round to three decimal places as needed.) there is no comelation there is a significant linear corelation Critical Values for the Pearson Correlation Coefficient Data Table Height, x IQ score, y Critical Values for the Pearson Corelation Coefficient 62 106 58 97 64 102 67 112 The correlation is significant when the absolute value of is greater than the value in the table. 59 92 65 105 -005a– 0.01 66 55 114 0.950 0.990 0.959 0.917 0.960 123 0.878 0.875 0.834 0.798 0.765 0.735 0.708 0.684 0.661 0.641 0.623 0.606 0.590 0.754 0.707 0.666 0.632 Print Done 10 11 12 13 0.002 0576 0.553 0.532 0.514 0.497 0.482 0.468 14 15 16 17 18 19 0.456 0.575 20 21 22 0.444 0.433 0423 0.561 0.549 0.537 23 0.413 0.404 0.396 0.388 0.381 0374 0.367 0.526 24 26 27 28 29 0.505 0.496 0.487 0.479 0.471 0463

Glencoe Algebra 1, Student Edition, 9780079039897, 0079039898, 2018
18th Edition
ISBN:9780079039897
Author:Carter
Publisher:Carter
Chapter10: Statistics
Section10.4: Distributions Of Data
Problem 19PFA

Related questions
Question
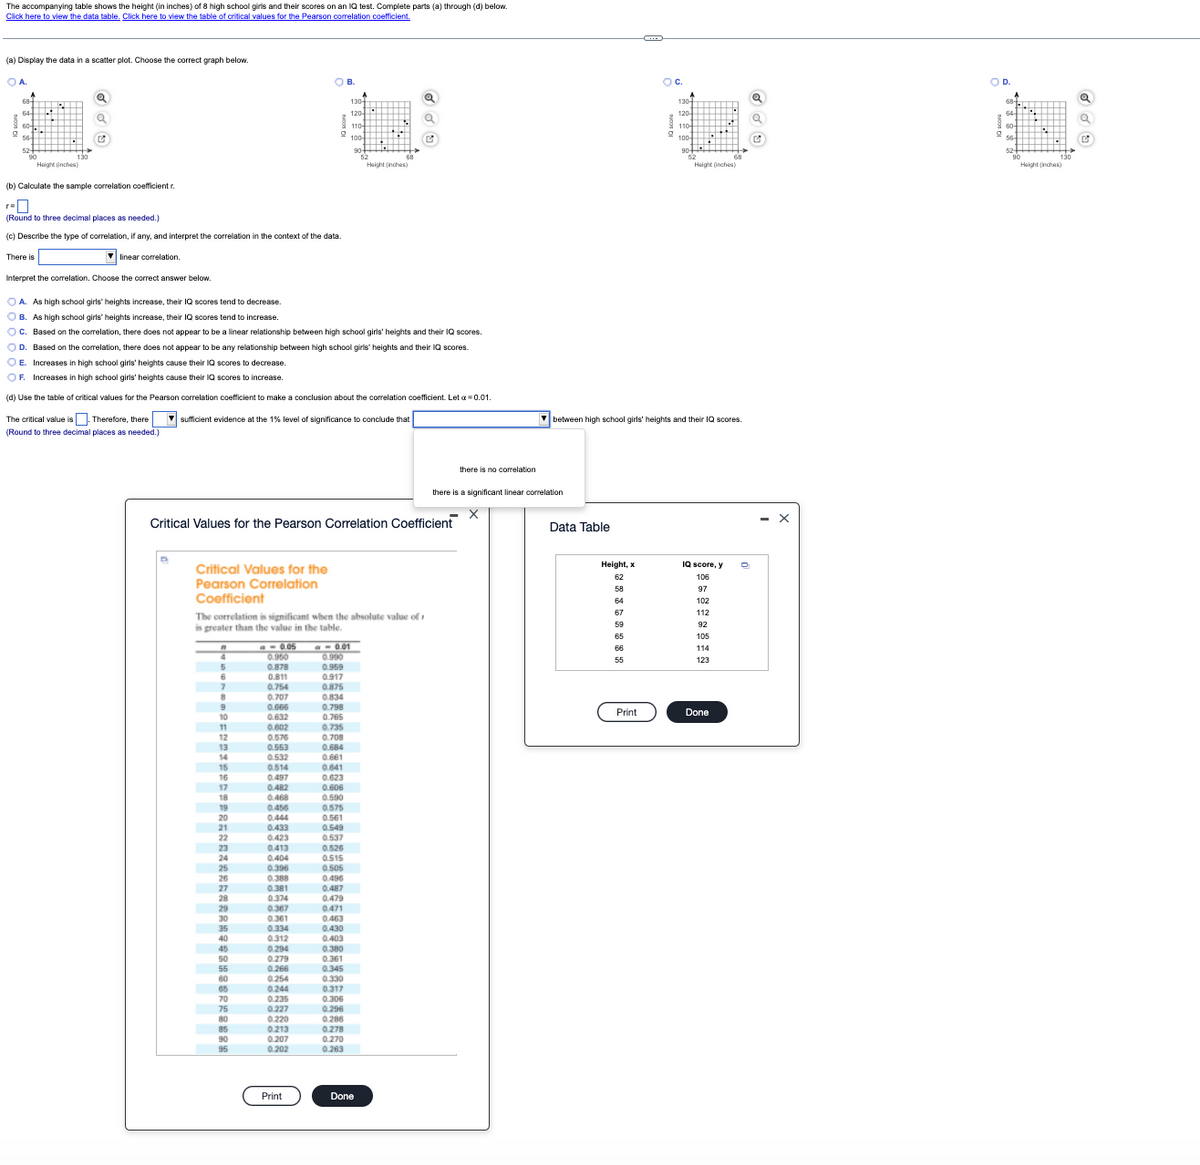
Transcribed Image Text:The accompanying table shows the height (in inches) of 8 high school girls and their scores on an IQ test. Complete parts (a) through (d) below.
Click here to view the data table. Click here to view the table of critical values for the Pearson correlation coefficient.
(a) Display the data in a scatter plot. Choose the correct graph below.
OB.
Oc.
OD.
130
64
60-
130
Height inches)
Height (inches)
Height (inches)
Haight (inches)
(b) Calculate the sample correlation coefficient r.
(Round to three decimal places as needed.)
(c) Describe the type of correlation, if any, and interpret the correlation in the context of the data.
There is
V linear correlation.
Interpret the correlation, Choose the correct answer below.
OA. As high school girls' heights increase, their 1Q scores tend to decrease.
OB. As high school girls' heights increase, their IQ scores tend to increase.
OC. Based on the correlation, there does not appear to be a linear relationship between high school girls' heights and their IQ scores.
OD. Based on the correlation, there does not appear to be any relationship between high school girls' heights and their IQ scores.
OE. Increases in high school girls' heights cause their IQ scores to decrease.
OF. Increases in high school girls' heights cause their IQ scores to increase.
(d) Use the table of critical values for the Pearson correlation coefficient to make a conclusion about the correlation coefficient. Let a = 0.01.
The critical value is Therefore, there
V sufficient evidence at the 1% level of significance to conclude that
V between high school girls' heights and their IQ scores.
(Round to three decimal places as needed.)
there is no correlation
there is a significant linear correlation
Critical Values for the Pearson Correlation Coefficient
Data Table
- X
Height, x
IQ score, y
Critical Values for the
Pearson Correlation
Coefficient
62
106
58
97
64
102
67
112
The correlation is significant when the absolute value of
is greater than the value in the table.
59
92
65
105
a- 0.05
0.960
0.878
0.811
B-001
0.990
0.959
66
114
55
123
0.917
0.875
0.834
0.754
0.707
0.666
0.798
Print
Done
10
1
0.632
0.765
0.602
0.576
0.553
0.532
0.735
0.708
0.684
0.661
12
13
14
15
16
0.514
0.497
0.482
0.468
0.456
0.444
0.433
0.423
0.641
0.623
0.606
17
19
20
0.575
0.561
0.549
0.537
21
22
23
0.413
0.526
24
0.404
0.515
25
0.396
0.505
26
0.388
0.496
27
0.381
0.487
28
0.374
0.479
0.471
29
30
35
0.367
0.361
0.463
0.430
0.334
0.312
0.294
0.279
40
0.403
0.380
0.361
0.345
0.330
0.317
0.306
0.296
45
50
55
0.266
60
0.254
0.244
0.235
70
75
80
85
90
0.227
0.220
0.213
0.207
0.286
0.278
0.270
95
0.202
0263
Print
Done
Expert Solution
This question has been solved!
Explore an expertly crafted, step-by-step solution for a thorough understanding of key concepts.

This is a popular solution!

Trending now
This is a popular solution!

Step by step
Solved in 5 steps with 1 images

Recommended textbooks for you
Glencoe Algebra 1, Student Edition, 9780079039897…
Algebra
ISBN:
9780079039897
Author:
Carter
Publisher:
McGraw Hill

Big Ideas Math A Bridge To Success Algebra 1: Stu…
Algebra
ISBN:
9781680331141
Author:
HOUGHTON MIFFLIN HARCOURT
Publisher:
Houghton Mifflin Harcourt

Holt Mcdougal Larson Pre-algebra: Student Edition…
Algebra
ISBN:
9780547587776
Author:
HOLT MCDOUGAL
Publisher:
HOLT MCDOUGAL
Glencoe Algebra 1, Student Edition, 9780079039897…
Algebra
ISBN:
9780079039897
Author:
Carter
Publisher:
McGraw Hill
Big Ideas Math A Bridge To Success Algebra 1: Stu…
Algebra
ISBN:
9781680331141
Author:
HOUGHTON MIFFLIN HARCOURT
Publisher:
Houghton Mifflin Harcourt
Holt Mcdougal Larson Pre-algebra: Student Edition…
Algebra
ISBN:
9780547587776
Author:
HOLT MCDOUGAL
Publisher:
HOLT MCDOUGAL