a. What kind of statistical test is this? b. Is the overall test statistically significant? How do you know? c. Which of the post hoc group comparisons are statistically significant?
a. What kind of statistical test is this? b. Is the overall test statistically significant? How do you know? c. Which of the post hoc group comparisons are statistically significant?

MATLAB: An Introduction with Applications
6th Edition
ISBN:9781119256830
Author:Amos Gilat
Publisher:Amos Gilat
Chapter1: Starting With Matlab
Section: Chapter Questions
Problem 1P

Related questions
Question
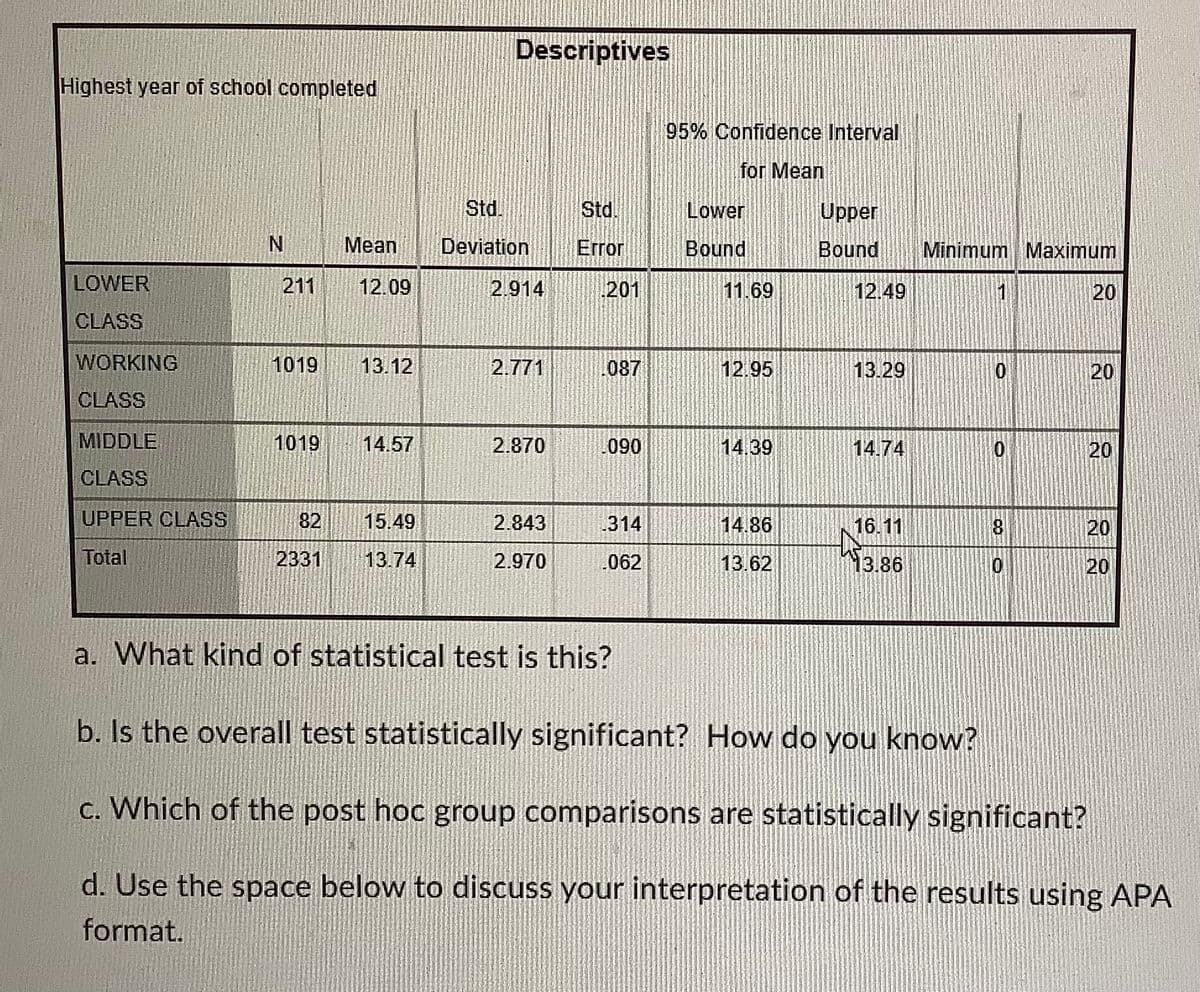
Transcribed Image Text:Descriptives
Highest year of school completed
95% Confidence Interval
for Mean
Std.
Std.
Lower
Upper
Mean
Deviation
Error
Bound
Bound
Minimum Maximum
LOWER
211
12.09
2.914
201
11.69
12.49
20
CLASS
WORKING
1019
13.12
2.771
087
12.95
13.29
20
CLASS
MIDDLE
1019
14.57
2.870
090
14.39
14.74
20
CLASS
UPPER CLASS
82
15.49
2.843
314
14.86
16.11
8.
20
Total
2331
13.74
2.970
062
13.62
13.86
20
a. What kind of statistical test is this?
b. Is the overall test statistically significant? How do you know?
c. Which of the post hoc group comparisons are statistically significant?
d. Use the space below to discuss your interpretation of the results using APA
format.
CO
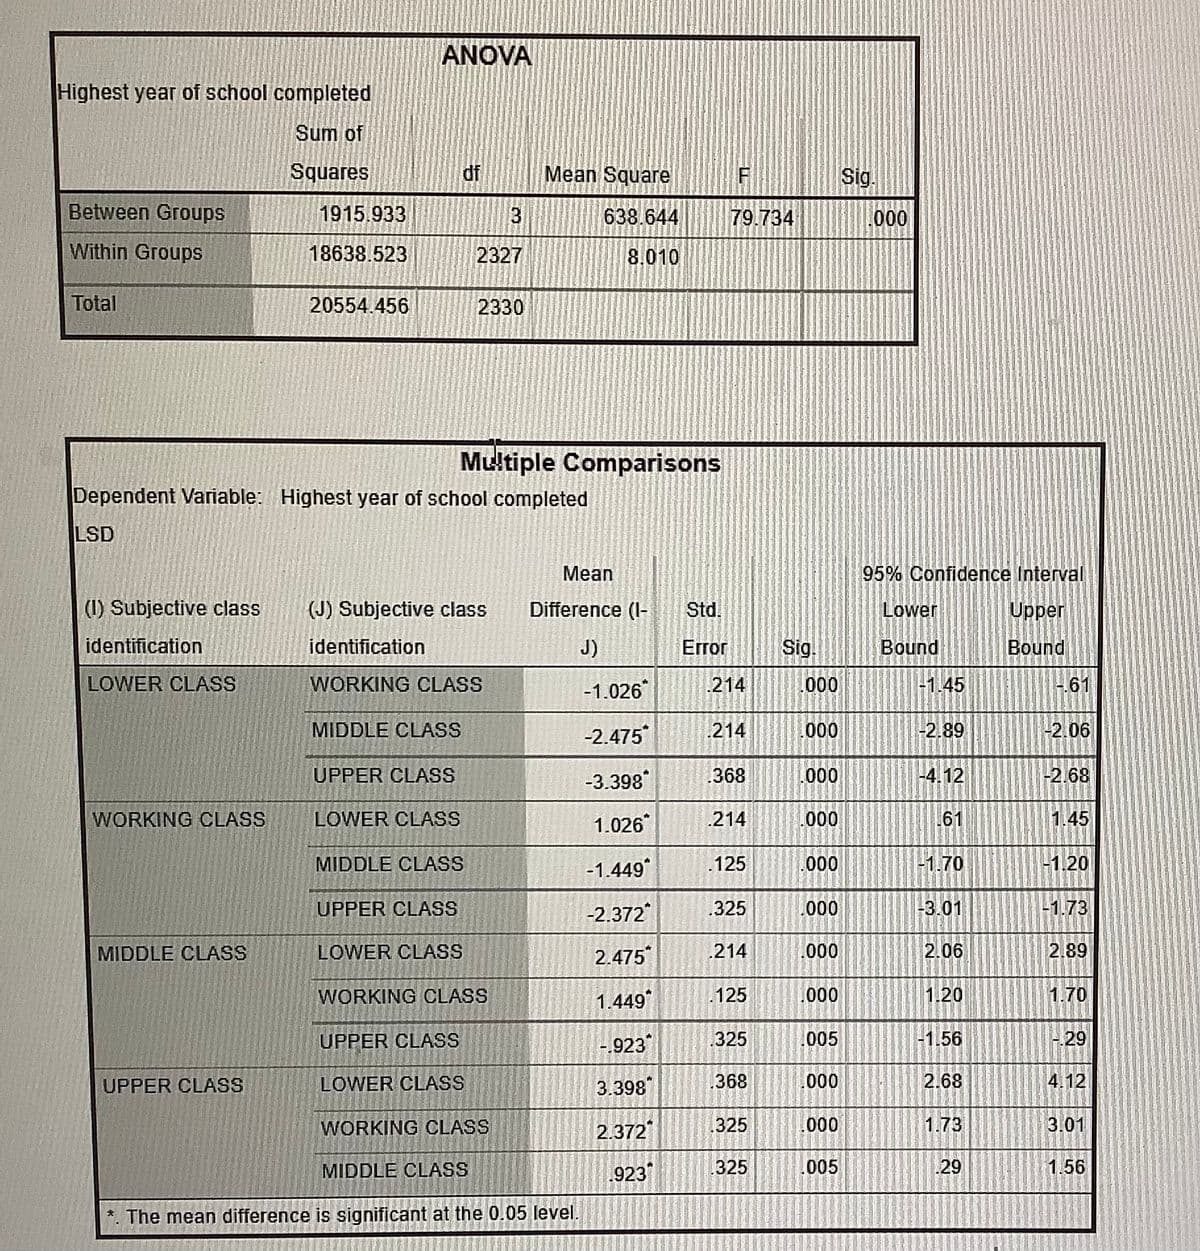
Transcribed Image Text:ANOVA
Highest year of school completed
Sum of
Squares
df
Mean Square
Sig.
Between Groups
1915.933
3
638.644
79.734
000
Within Groups
18638.523
2327
8.010
Total
20554.456
2330
Multiple Comparisons
Dependent Variable: Highest year of school completed
LSD
Mean
95% Confidence Interval
(1) Subjective class
(J) Subjective class
Difference (I-
Std.
Lower
Upper
identification
identification
J)
Error
Sig.
Bound
Bound
LOWER CLASS
WORKING CLASS
-1.026
214
000
1.45
61
MIDDLE CLASS
-2.475
214
000
-2.89
2.06
UPPER CLASS
-3.398
.368
00
-4.12
-2.68
WORKING CLASS
LOWER CLASS
1.026
214
.000
61
1.45
MIDDLE CLASS
-1.449
.125
.000
-1.70
-1.20
UPPER CLASS
-2.372
.325
.000
-3.01
-1.73
MIDDLE CLASS
LOWER CLASS
2.475
.214
.000
2.06
2.89
WORKING CLASS
1.449
.125
000
1.20
1.70
UPPER CLASS
-.923
.325
005
-1.56
29
UPPER CLASS
LOWER CLASS
3.398
368
000
2.68
4.12
WORKING CLASS
2.372
325
000
1.73
3.01
MIDDLE CLASS
923
325
005
29
1.56
*. The mean difference is significant at the 0.05 level.
Expert Solution
This question has been solved!
Explore an expertly crafted, step-by-step solution for a thorough understanding of key concepts.

Step by step
Solved in 3 steps

Recommended textbooks for you
MATLAB: An Introduction with Applications
Statistics
ISBN:
9781119256830
Author:
Amos Gilat
Publisher:
John Wiley & Sons Inc

Probability and Statistics for Engineering and th…
Statistics
ISBN:
9781305251809
Author:
Jay L. Devore
Publisher:
Cengage Learning

Statistics for The Behavioral Sciences (MindTap C…
Statistics
ISBN:
9781305504912
Author:
Frederick J Gravetter, Larry B. Wallnau
Publisher:
Cengage Learning
MATLAB: An Introduction with Applications
Statistics
ISBN:
9781119256830
Author:
Amos Gilat
Publisher:
John Wiley & Sons Inc
Probability and Statistics for Engineering and th…
Statistics
ISBN:
9781305251809
Author:
Jay L. Devore
Publisher:
Cengage Learning
Statistics for The Behavioral Sciences (MindTap C…
Statistics
ISBN:
9781305504912
Author:
Frederick J Gravetter, Larry B. Wallnau
Publisher:
Cengage Learning

Elementary Statistics: Picturing the World (7th E…
Statistics
ISBN:
9780134683416
Author:
Ron Larson, Betsy Farber
Publisher:
PEARSON

The Basic Practice of Statistics
Statistics
ISBN:
9781319042578
Author:
David S. Moore, William I. Notz, Michael A. Fligner
Publisher:
W. H. Freeman

Introduction to the Practice of Statistics
Statistics
ISBN:
9781319013387
Author:
David S. Moore, George P. McCabe, Bruce A. Craig
Publisher:
W. H. Freeman