The following data on price (8) and the overall score for 6 stereo headphones that were tested by Consumer Reports were as follows. The estimated regression equation for these data is y = 26.239 + 0.309z. Brand Price Score Bose 190 77 Scullcandy 150 78 Kos 85 61 Phillips/O'Neill 80 56 Denon 80 50 JVC 35 27 1. Does the t test indicate a significant relationship between price and the overall score? Compute the value of the t test statistic. Use a = 0.05 (to 2 decimal places.) Ise Table 2 of Appendix B to find the p-value. he p-value is between 0.01 and 0.02 v Vhat is your conclusion? Use a = 0.05. There is a significant relationship between price and overall score v . Test for a significant relationship using the F test. Use Table 4 of Appendix B. -value is between 0.01 and 0.025 vO Vhat is your conclusion? Use a = 0.05. Because p-value is less than or equal to 0.05. we reject vO Họ : B, is equal to zero . Show the ANOVA table for these data. Round your answers to three decimal places, if necessary. Do not round intermediate calculations. Source of Sum of Degrees of Wariation p-value (to 4 decimals) Squares Freedom Mean Square Regression Error Total

College Algebra
1st Edition
ISBN:9781938168383
Author:Jay Abramson
Publisher:Jay Abramson
Chapter4: Linear Functions
Section: Chapter Questions
Problem 30PT: For the following exercises, use Table 4 which shows the percent of unemployed persons 25 years or...
icon
Related questions
icon
Concept explainers
Question

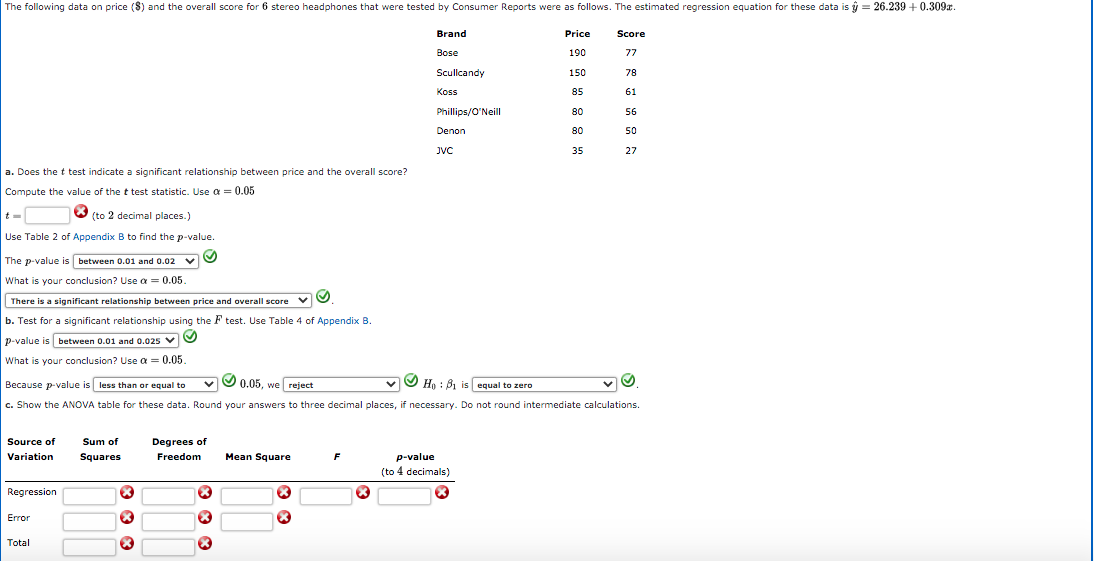
The following data on price ($) and the overall score for 6 stereo headphones that were tested by Consumer Reports were as follows. The estimated regression equation for these data is y = 26.239 + 0.309x.

(NEED ANSWERS FOR A and C)

The following data on price (8) and the overall score for 6 stereo headphones that were tested by Consumer Reports were as follows. The estimated regression equation for these data is y = 26.239 + 0.309r.
Brand
Price
Score
Bose
190
77
Scullcandy
150
78
Koss
85
61
Phillips/O'Neill
80
56
Denon
80
50
JVC
35
27
a. Does the t test indicate a significant relationship between price and the overall score?
Compute the value of the t test statistic. Use a = 0.05
t =
(to 2 decimal places.)
Use Table 2 of Appendix B to find the p-value.
The p-value is between 0.01 and 0.02 v
What is your conclusion? Use a = 0.05.
There is a significant relationship between price and overall score V O
b. Test for a significant relationship using the F test. Use Table 4 of Appendix B.
p-value is between 0.01 and 0.025 vO
What is your conclusion? Use a = 0.05.
Because p-value is less than or equal to
O 0.05, we reject
Họ : Bị is equal to zero
c. Show the ANOVA table for these data. Round your answers to three decimal places, if necessary. Do not round intermediate calculations.
Source of
Sum of
Degrees of
Variation
Squares
Freedom
Mean Square
F
p-value
(to 4 decimals)
Regression
Error
Total
Transcribed Image Text:The following data on price (8) and the overall score for 6 stereo headphones that were tested by Consumer Reports were as follows. The estimated regression equation for these data is y = 26.239 + 0.309r. Brand Price Score Bose 190 77 Scullcandy 150 78 Koss 85 61 Phillips/O'Neill 80 56 Denon 80 50 JVC 35 27 a. Does the t test indicate a significant relationship between price and the overall score? Compute the value of the t test statistic. Use a = 0.05 t = (to 2 decimal places.) Use Table 2 of Appendix B to find the p-value. The p-value is between 0.01 and 0.02 v What is your conclusion? Use a = 0.05. There is a significant relationship between price and overall score V O b. Test for a significant relationship using the F test. Use Table 4 of Appendix B. p-value is between 0.01 and 0.025 vO What is your conclusion? Use a = 0.05. Because p-value is less than or equal to O 0.05, we reject Họ : Bị is equal to zero c. Show the ANOVA table for these data. Round your answers to three decimal places, if necessary. Do not round intermediate calculations. Source of Sum of Degrees of Variation Squares Freedom Mean Square F p-value (to 4 decimals) Regression Error Total
Expert Solution
trending now

Trending now

This is a popular solution!

steps

Step by step

Solved in 4 steps with 5 images

Blurred answer
Knowledge Booster
Correlation, Regression, and Association
Learn more about
Need a deep-dive on the concept behind this application? Look no further. Learn more about this topic, statistics and related others by exploring similar questions and additional content below.
Similar questions
Recommended textbooks for you
College Algebra
College Algebra
Algebra
ISBN:
9781938168383
Author:
Jay Abramson
Publisher:
OpenStax
Glencoe Algebra 1, Student Edition, 9780079039897…
Algebra
ISBN:
9780079039897
Author:
Carter
Publisher:
McGraw Hill
Functions and Change: A Modeling Approach to Coll…
Algebra
ISBN:
9781337111348
Author:
Bruce Crauder, Benny Evans, Alan Noell
Publisher:
Cengage Learning
Big Ideas Math A Bridge To Success Algebra 1: Stu…
Algebra
ISBN:
9781680331141
Author:
HOUGHTON MIFFLIN HARCOURT
Publisher:
Houghton Mifflin Harcourt