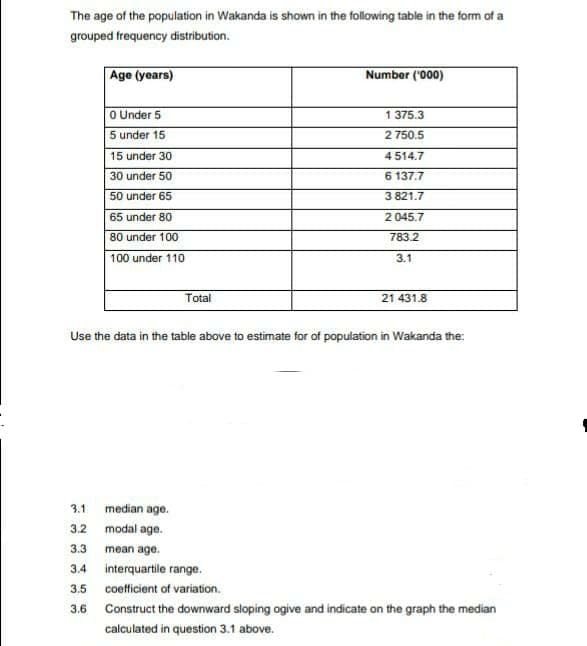
The age of the population in Wakanda is shown in the following table in the form of a grouped frequency distribution. Age (years) Number ('000) O Under 5 5 under 15 1375.3 2 750.5 15 under 30 4 514.7 30 under 50 6 137.7 50 under 65 3 821.7 65 under 80 2 045.7 80 under 100 783.2 100 under 110 3.1 Total 21 431.8 Use the data in the table above to estimate for of population in Wakanda the: 3.1 median age. 3.2 modal age. 3.3 mean age. 3.4 interquartile range. 3.5 coefficient of variation. 3.6 Construct the downward sloping ogive and indicate on the graph the median calculated in question 3.1 above.


Inverse Normal Distribution
The method used for finding the corresponding z-critical value in a normal distribution using the known probability is said to be an inverse normal distribution. The inverse normal distribution is a continuous probability distribution with a family of two parameters.
Mean, Median, Mode
It is a descriptive summary of a data set. It can be defined by using some of the measures. The central tendencies do not provide information regarding individual data from the dataset. However, they give a summary of the data set. The central tendency or measure of central tendency is a central or typical value for a probability distribution.
Z-Scores
A z-score is a unit of measurement used in statistics to describe the position of a raw score in terms of its distance from the mean, measured with reference to standard deviation from the mean. Z-scores are useful in statistics because they allow comparison between two scores that belong to different normal distributions.

Step by step
Solved in 4 steps with 2 images


