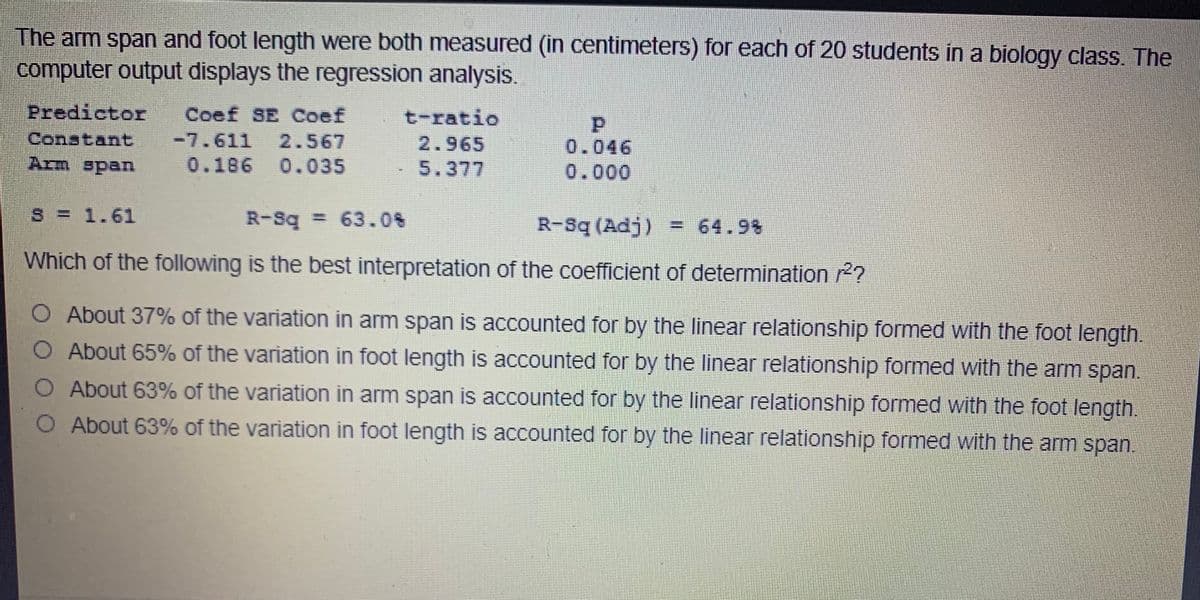
The arm span and foot length were both measured (in centimeters) for each of 20 students in a biology class. The computer output displays the regression analysis. Predictor Coef SE Coef t-ratio Constant -7.611 2.567 0.186 0.035 2.965 0.046 Arm span - 5.377 0.000 S = 1.61 R-Sq 63.0% R-Sq (Adj) = 64.9% Which of the following is the best interpretation of the coefficient of determination 2? O About 37% of the variation in arm span is accounted for by the linear relationship formed with the foot length. O About 65% of the variation in foot length is accounted for by the linear relationship formed with the arm span. O About 63% of the variation in arm span is accounted for by the linear relationship formed with the foot length. O About 63% of the variation in foot length is accounted for by the linear relationship formed with the arm span.


Correlation
Correlation defines a relationship between two independent variables. It tells the degree to which variables move in relation to each other. When two sets of data are related to each other, there is a correlation between them.
Linear Correlation
A correlation is used to determine the relationships between numerical and categorical variables. In other words, it is an indicator of how things are connected to one another. The correlation analysis is the study of how variables are related.
Regression Analysis
Regression analysis is a statistical method in which it estimates the relationship between a dependent variable and one or more independent variable. In simple terms dependent variable is called as outcome variable and independent variable is called as predictors. Regression analysis is one of the methods to find the trends in data. The independent variable used in Regression analysis is named Predictor variable. It offers data of an associated dependent variable regarding a particular outcome.


Trending now
This is a popular solution!

Step by step
Solved in 3 steps


