The article "Bone Density and Insertion Torque as Predictors of Anterior Cruciate Ligament Graft Fixation Strength"t gave the accompanying data on maximum insertion torque (N · m) and yield load (N), the latter being one measure of graft strength, for 15 different specimens. Torque 1.8 2.2 1.9 1.3 2.1 2.2 1.6 2.1 1.2 1.8 2.6 2.5 2.5 1.7 1.6 Load 491 477 598 361 605 671 466 431 384 422 554 577 642 348 446 (a) Is it plausible that yield load is normally distributed? O Yes, there are more than thirty data values. O No, a normal probability plot of yield load is not quite linear. O Yes, a normal probability plot of yield load is quite quadratic. No, there is not more than thirty data values. Yes, a normal probability plot of yield load is quite linear. (b) Estimate true average yield load by calculating a confidence interval with a confidence level of 95%. (Round your answer to two decimal places.) Interpret the Interval. O we are 95% confident that the true population average yield load lies below this interval. We are 95% confident that this interval does not contain the true average yield load. O we are 95% confident that the true population average yield load lies above this interval. We are 95% confident that this interval contains the true average yield load. (c) Here is output from Minitab for the regression of yield load on torque. Predictor Coef SE Coef T P Constant 152.4 91.17 1.67 0.118 Torque S = 73.2141 178.23 45.97 3.88 0.002 R-Sq = 53.6% R-Sq (adj) = 50.0% Source DF MS F P Regression 80554 80554 15.03 0.002 Residual Error 13 69684 5360 Total 14 150238 Does the simple linear regression model specify a useful relationship between the variables? O Yes, the t-statistic and P-value are significant at any reasonable level, so we can conclude that a useful linear relationship exists. O No, the t-statistic and P-value are not significant at any reasonable level, so we can conclude that a useful linear relationship exists. O Yes, the t-statistic and P-value are significant at any reasonable level, so we cannot conclude that a useful linear relationship exists. O No, the t-statistic and P-value are not significant at any reasonable level, so we cannot conclude that a useful linear relationship exists.
The article "Bone Density and Insertion Torque as Predictors of Anterior Cruciate Ligament Graft Fixation Strength"t gave the accompanying data on maximum insertion torque (N · m) and yield load (N), the latter being one measure of graft strength, for 15 different specimens. Torque 1.8 2.2 1.9 1.3 2.1 2.2 1.6 2.1 1.2 1.8 2.6 2.5 2.5 1.7 1.6 Load 491 477 598 361 605 671 466 431 384 422 554 577 642 348 446 (a) Is it plausible that yield load is normally distributed? O Yes, there are more than thirty data values. O No, a normal probability plot of yield load is not quite linear. O Yes, a normal probability plot of yield load is quite quadratic. No, there is not more than thirty data values. Yes, a normal probability plot of yield load is quite linear. (b) Estimate true average yield load by calculating a confidence interval with a confidence level of 95%. (Round your answer to two decimal places.) Interpret the Interval. O we are 95% confident that the true population average yield load lies below this interval. We are 95% confident that this interval does not contain the true average yield load. O we are 95% confident that the true population average yield load lies above this interval. We are 95% confident that this interval contains the true average yield load. (c) Here is output from Minitab for the regression of yield load on torque. Predictor Coef SE Coef T P Constant 152.4 91.17 1.67 0.118 Torque S = 73.2141 178.23 45.97 3.88 0.002 R-Sq = 53.6% R-Sq (adj) = 50.0% Source DF MS F P Regression 80554 80554 15.03 0.002 Residual Error 13 69684 5360 Total 14 150238 Does the simple linear regression model specify a useful relationship between the variables? O Yes, the t-statistic and P-value are significant at any reasonable level, so we can conclude that a useful linear relationship exists. O No, the t-statistic and P-value are not significant at any reasonable level, so we can conclude that a useful linear relationship exists. O Yes, the t-statistic and P-value are significant at any reasonable level, so we cannot conclude that a useful linear relationship exists. O No, the t-statistic and P-value are not significant at any reasonable level, so we cannot conclude that a useful linear relationship exists.

MATLAB: An Introduction with Applications
6th Edition
ISBN:9781119256830
Author:Amos Gilat
Publisher:Amos Gilat
Chapter1: Starting With Matlab
Section: Chapter Questions
Problem 1P

Related questions
Question
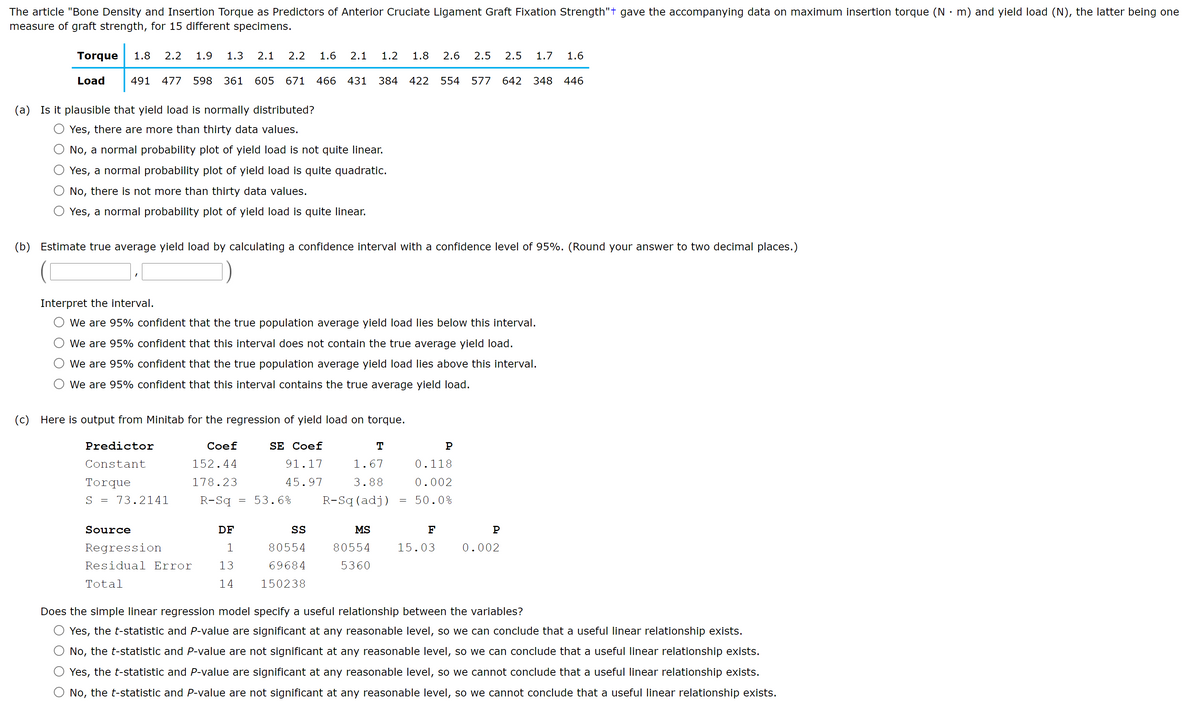
Transcribed Image Text:The article "Bone Density and Insertion Torque as Predictors of Anterior Cruciate Ligament Graft Fixation Strength"t gave the accompanying data on maximum insertion torque (N• m) and yield load (N), the latter being one
measure of graft strength, for 15 different specimens.
Torque
1.8
2.2
1.9
1.3
2.1
2.2
1.6
2.1
1.2
1.8
2.6
2.5
2.5
1.7
1.6
Load
491
477
598
361
605
671 466
431
384
422
554
577
642
348
446
(a) Is it plausible that yield load is normally distributed?
Yes, there are more than thirty data values.
No, a normal probability plot of yield load is not quite linear.
Yes, a normal probability plot of yield load is quite quadratic.
No, there is not more than thirty data values.
Yes, a normal probability plot of yield load is quite linear.
(b) Estimate true average yield load by calculating a confidence interval with a confidence level of 95%. (Round your answer to two decimal places.)
Interpret the interval.
We are 95% confident that the true population average yield load lies below this interval.
We are 95% confident that this interval does not contain the true average yield load.
We are 95% confident that the true population average yield load lies above this interval.
We are 95% confident that this interval contains the true average yield load.
(c) Here is output from Minitab for the regression of yield load on torque.
Predictor
Coef
SE Coef
T
P
Constant
152.44
91.17
1.67
0.118
Torque
178.23
45.97
3.88
0.002
S = 73.2141
R-Sq
53.6%
R-Sq (adj)
50.0%
Source
DF
S
MS
F
P
Regression
1
80554
80554
15.03
0.002
Residual Error
13
69684
5360
Total
14
150238
Does the simple linear regression model specify a useful relationship between the variables?
Yes, the t-statistic and P-value are significant at any reasonable level, so we can conclude that a useful linear relationship exists.
No, the t-statistic and P-value are not significant at any reasonable level, so we can conclude that a useful linear relationship exists.
Yes, the t-statistic and P-value are significant at any reasonable level, so we cannot conclude that a useful linear relationship exists.
No, the t-statistic and P-value are not significant at any reasonable level, so we cannot conclude that a useful linear relationship exists.
Expert Solution
This question has been solved!
Explore an expertly crafted, step-by-step solution for a thorough understanding of key concepts.

This is a popular solution!

Trending now
This is a popular solution!

Step by step
Solved in 3 steps with 1 images

Recommended textbooks for you
MATLAB: An Introduction with Applications
Statistics
ISBN:
9781119256830
Author:
Amos Gilat
Publisher:
John Wiley & Sons Inc

Probability and Statistics for Engineering and th…
Statistics
ISBN:
9781305251809
Author:
Jay L. Devore
Publisher:
Cengage Learning

Statistics for The Behavioral Sciences (MindTap C…
Statistics
ISBN:
9781305504912
Author:
Frederick J Gravetter, Larry B. Wallnau
Publisher:
Cengage Learning
MATLAB: An Introduction with Applications
Statistics
ISBN:
9781119256830
Author:
Amos Gilat
Publisher:
John Wiley & Sons Inc
Probability and Statistics for Engineering and th…
Statistics
ISBN:
9781305251809
Author:
Jay L. Devore
Publisher:
Cengage Learning
Statistics for The Behavioral Sciences (MindTap C…
Statistics
ISBN:
9781305504912
Author:
Frederick J Gravetter, Larry B. Wallnau
Publisher:
Cengage Learning

Elementary Statistics: Picturing the World (7th E…
Statistics
ISBN:
9780134683416
Author:
Ron Larson, Betsy Farber
Publisher:
PEARSON

The Basic Practice of Statistics
Statistics
ISBN:
9781319042578
Author:
David S. Moore, William I. Notz, Michael A. Fligner
Publisher:
W. H. Freeman

Introduction to the Practice of Statistics
Statistics
ISBN:
9781319013387
Author:
David S. Moore, George P. McCabe, Bruce A. Craig
Publisher:
W. H. Freeman