The article "Probabilistic Risk Assessment of Infrastructure Networks Subjected to Hurricanes"t suggests a uniform distribution as a model for the actual landfall position of the eye of a hurricane. Consider the random variable x = distance of actual landfall from predicted landfall. Suppose that a uniform distribution on the interval that ranges from 0 km to 400 km is a reasonable model for x. (a) What is the probability that x is at most 300? (b) What is the probability that x is between 300 and 450? (c) What is the probability that x is between 150 and 300? (d) Explain why the probabilities calculated in parts (b) and (c) are equal.
The article "Probabilistic Risk Assessment of Infrastructure Networks Subjected to Hurricanes"t suggests a uniform distribution as a model for the actual landfall position of the eye of a hurricane. Consider the random variable x = distance of actual landfall from predicted landfall. Suppose that a uniform distribution on the interval that ranges from 0 km to 400 km is a reasonable model for x. (a) What is the probability that x is at most 300? (b) What is the probability that x is between 300 and 450? (c) What is the probability that x is between 150 and 300? (d) Explain why the probabilities calculated in parts (b) and (c) are equal.

MATLAB: An Introduction with Applications
6th Edition
ISBN:9781119256830
Author:Amos Gilat
Publisher:Amos Gilat
Chapter1: Starting With Matlab
Section: Chapter Questions
Problem 1P

Related questions
Question
4
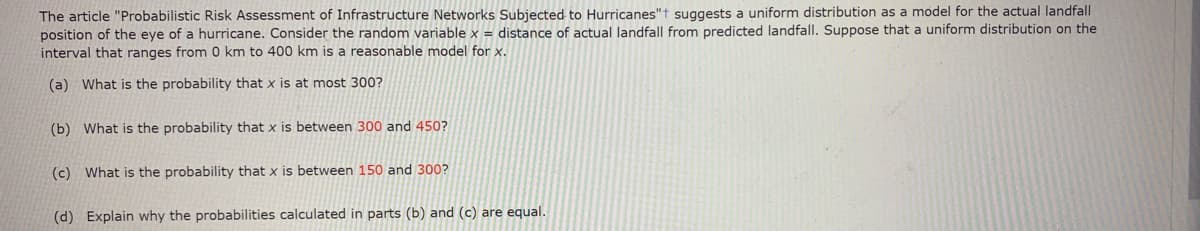
Transcribed Image Text:The article "Probabilistic Risk Assessment of Infrastructure Networks Subjected to Hurricanes"t suggests a uniform distribution as a model for the actual landfall
position of the eye of a hurricane. Consider the random variable x = distance of actual landfall from predicted landfall. Suppose that a uniform distribution on the
interval that ranges from 0 km to 400 km is a reasonable model for x.
(a) What is the probability that x is at most 300?
(b) What is the probability that x is between 300 and 450?
(c) What is the probability that x is between 150 and 300?
(d) Explain why the probabilities calculated in parts (b) and (c) are equal.
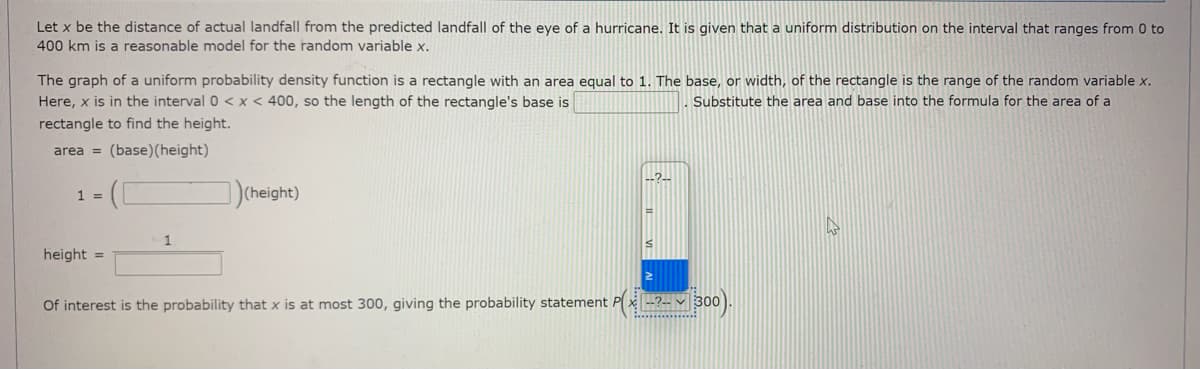
Transcribed Image Text:Let x be the distance of actual landfall from the predicted landfall of the eye of a hurricane. It is given that a uniform distribution on the interval that ranges from 0 to
400 km is a reasonable model for the random variable x.
The graph of a uniform probability density function is a rectangle with an area equal to 1. The base, or width, of the rectangle is the range of the random variable x.
Here, x is in the interval 0 < x < 400, so the length of the rectangle's base is
Substitute the area and base into the formula for the area of a
rectangle to find the height.
area = (base)(height)
--?--
)(theight)
1 =
1
height =
Of interest is the probability that x is at most 300, giving the probability statement P
2- v 300).
Expert Solution
This question has been solved!
Explore an expertly crafted, step-by-step solution for a thorough understanding of key concepts.

This is a popular solution!

Trending now
This is a popular solution!

Step by step
Solved in 4 steps

Recommended textbooks for you
MATLAB: An Introduction with Applications
Statistics
ISBN:
9781119256830
Author:
Amos Gilat
Publisher:
John Wiley & Sons Inc

Probability and Statistics for Engineering and th…
Statistics
ISBN:
9781305251809
Author:
Jay L. Devore
Publisher:
Cengage Learning

Statistics for The Behavioral Sciences (MindTap C…
Statistics
ISBN:
9781305504912
Author:
Frederick J Gravetter, Larry B. Wallnau
Publisher:
Cengage Learning
MATLAB: An Introduction with Applications
Statistics
ISBN:
9781119256830
Author:
Amos Gilat
Publisher:
John Wiley & Sons Inc
Probability and Statistics for Engineering and th…
Statistics
ISBN:
9781305251809
Author:
Jay L. Devore
Publisher:
Cengage Learning
Statistics for The Behavioral Sciences (MindTap C…
Statistics
ISBN:
9781305504912
Author:
Frederick J Gravetter, Larry B. Wallnau
Publisher:
Cengage Learning

Elementary Statistics: Picturing the World (7th E…
Statistics
ISBN:
9780134683416
Author:
Ron Larson, Betsy Farber
Publisher:
PEARSON

The Basic Practice of Statistics
Statistics
ISBN:
9781319042578
Author:
David S. Moore, William I. Notz, Michael A. Fligner
Publisher:
W. H. Freeman

Introduction to the Practice of Statistics
Statistics
ISBN:
9781319013387
Author:
David S. Moore, George P. McCabe, Bruce A. Craig
Publisher:
W. H. Freeman